Master Market Structure with the Pivot Lines Time Zone Indicator
In the world of professional day trading, price doesn't move in a vacuum; it reacts to specific, mathematically derived levels of Support And Resistance. Among the most trusted tools for identifying these "hidden" levels are Pivot Points. However, for global traders operating across different markets, the standard pivot calculation often fails due to time zone discrepancies. The Pivot Lines Time Zone indicator for MetaTrader 4 (MT4) is a specialized solution designed to align your technical analysis with the specific trading session that matters most to your strategy.
What is the Pivot Lines Time Zone Indicator?
The Pivot Lines Time Zone indicator is a dynamic charting tool that automatically calculates and plots Daily, Weekly, or Monthly pivot levels based on a user-defined time offset. Traditional pivot indicators rely on the broker’s server time, which can vary significantly and lead to inaccurate levels. This indicator allows you to synchronize your levels with major market opens—such as New York (EST) or London (GMT)—ensuring you are looking at the same structural boundaries as institutional players.
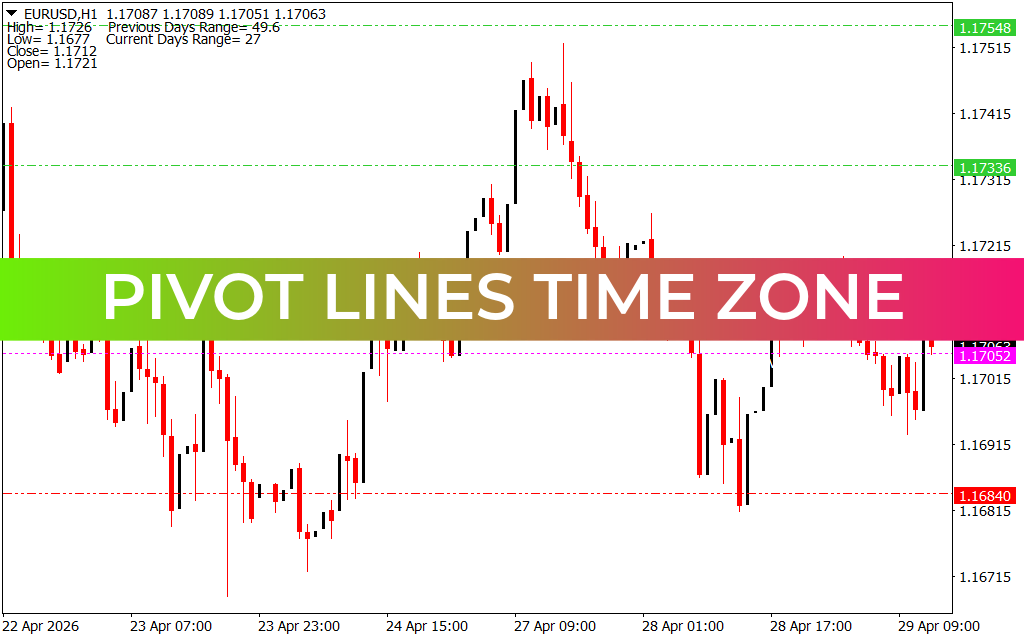
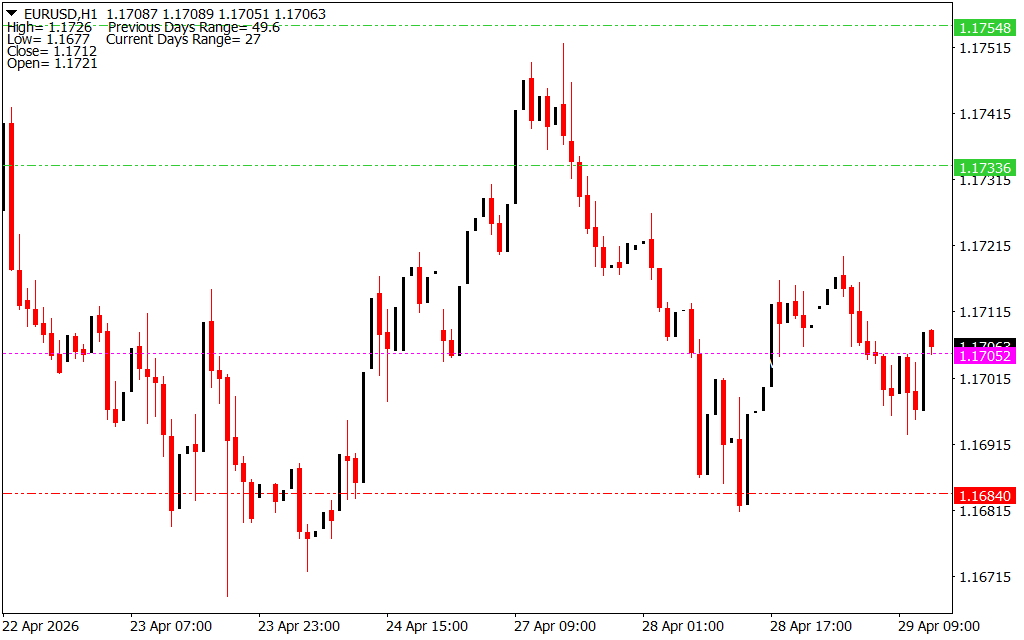
As demonstrated on the H1 timeframe, the indicator projects clear, horizontal lines across your chart. These include the central Pivot Point (PP), which acts as the primary trend filter, and multiple levels of resistance (R1, R2, R3) and support (S1, S2, S3).
The Power of Session Alignment
Trading is a game of probability, and the Pivot Lines Time Zone indicator increases those probabilities by providing "True" market levels:
- Accurate Support & Resistance: By adjusting the time zone, you capture the true high, low, and close of the previous trading day. This leads to more reliable bounces and breakouts.
- Session-Specific Strategy: Scalpers can set the indicator to the London open to find intraday targets, while swing traders can use Weekly pivots aligned with the market's true start.
- Visual Clarity: The indicator plots these levels as clean, dashed, or solid lines, often accompanied by labels, so you always know exactly where the market is likely to stall or accelerate.
Strategic Trading Applications
The Pivot Lines Time Zone is a versatile foundation for any trading system:
- The Pivot Bounce: When price approaches a support (S1) or resistance (R1) line that aligns with a major session open, look for reversal patterns. These levels often act as magnets for price.
- The Breakout Confirmation: If price breaks through the central Pivot Point with strong momentum, it signals a shift in market sentiment. Traders often use this as a trigger to target the next resistance level.
- Confluence with Other Tools: Combine these pivots with Fibonacci retracements or Moving Averages. When a Pivot Line overlaps with another technical level, it creates a "High-Probability Zone" for trade execution.
Conclusion
The Pivot Lines Time Zone indicator is an indispensable utility for traders who demand precision. It removes the confusion caused by differing broker times and provides a standardized map of the market. By aligning your charts with the global financial clock, you gain a clearer understanding of Market Structure and a significant edge in your daily trading execution.
3 Downloads
Last Update:
Apr 29, 2026 16:05 PM
Published:
Jan 30, 2026 22:26 PM
Category: