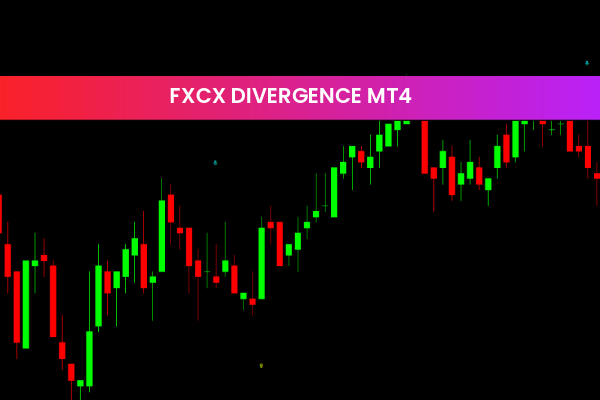
Mastering the OsMA Divergence Indicator: A Pro Edge for Trend Reversals
In the fast-paced world of Forex and CFD trading, spotting a Trend Reversal before it happens is the "holy grail" for many. While standard oscillators like the MACD are popular, experienced traders often turn to the OsMA (Oscillator of Moving Average) to get a more refined view of market momentum. When combined with divergence analysis, the OsMA becomes a lethal tool for identifying high-probability turning points on any timeframe.
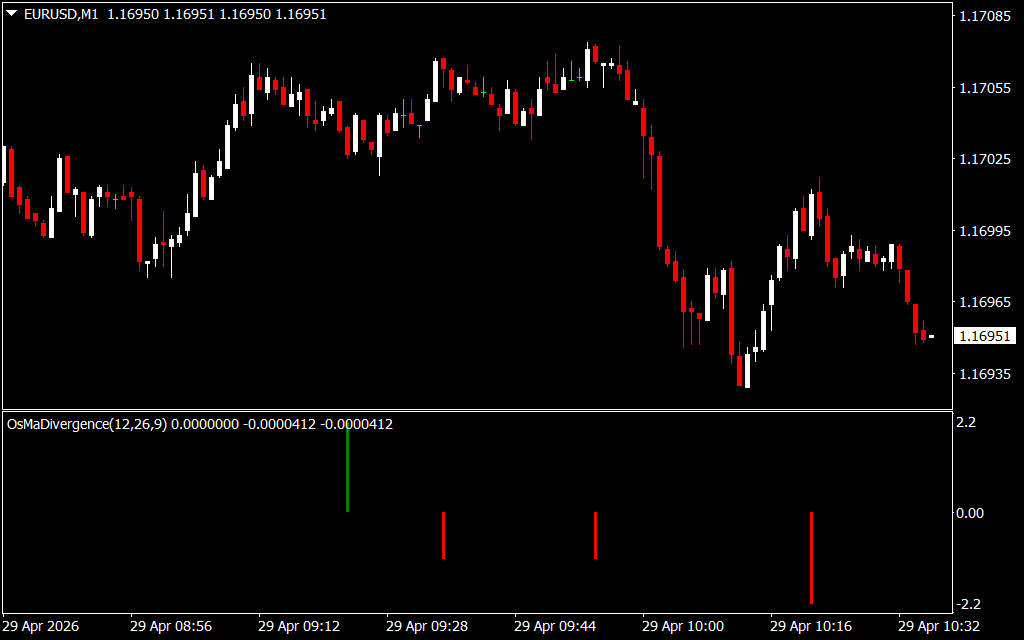
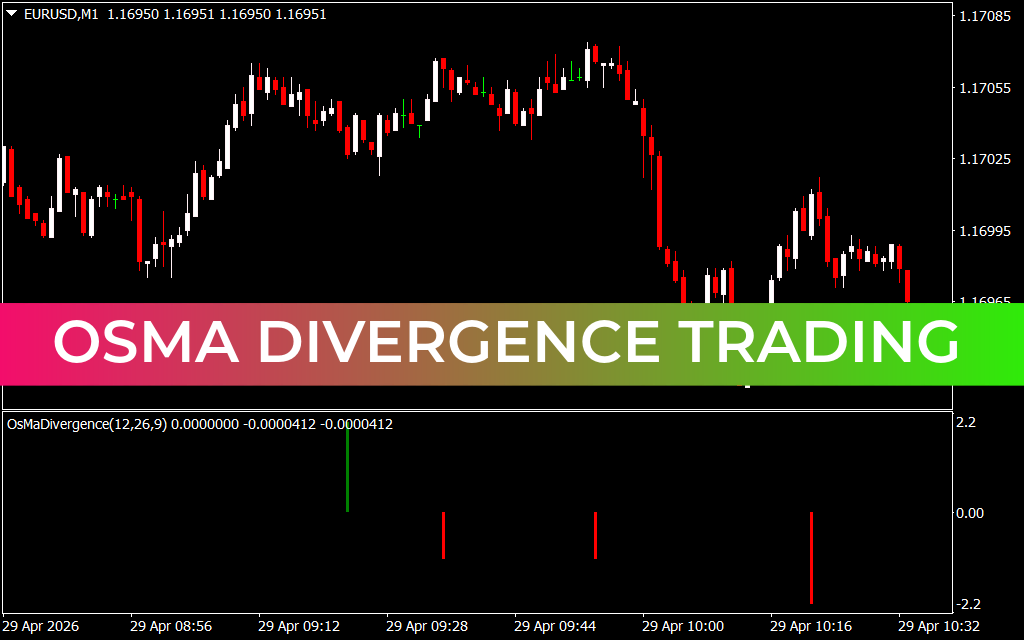
What is the OsMA Divergence Indicator?
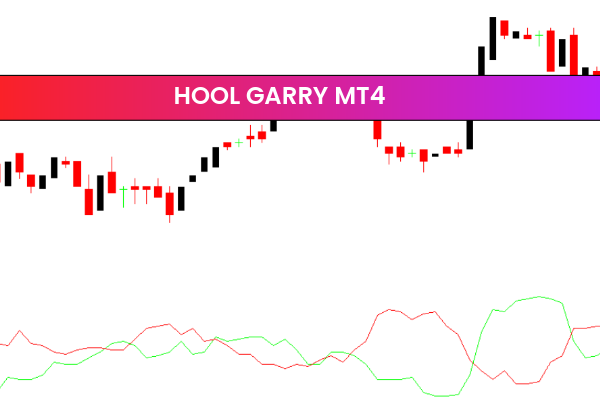
The OsMA is essentially the difference between the MACD value and its signal line. While the MACD tracks the relationship between two moving averages, the OsMA tracks the momentum of the MACD itself. When the OsMA is plotted as a histogram, it shows how fast the market is accelerating or decelerating.
OsMA Divergence occurs when the Price Action of an asset moves in the opposite direction of the OsMA histogram. This discrepancy is a powerful warning sign that the current trend is losing steam and a reversal is likely on the horizon.
Why Trade OsMA Divergence?
Standard indicators often lag behind price, leading to late entries. OsMA Divergence is considered a "leading" signal because it measures the underlying strength of a move.
- Early Warning System: Divergence often appears several candles before a major price shift, giving traders time to prepare.
- Reduced Noise: Because the OsMA is an oscillator of an oscillator, it filters out minor price fluctuations that often trigger false signals in faster indicators.
- Versatility: Whether you are Scalping the M1 chart for quick pips or swing trading the daily charts, OsMA Divergence patterns remain mathematically consistent.
How to Identify Winning Setups
There are two primary types of OsMA Divergence to watch for:
- Bullish Divergence: The price makes a "Lower Low," but the OsMA histogram makes a "Higher Low." This indicates that selling pressure is fading despite the lower prices, often leading to a bullish breakout.
- Bearish Divergence: The price hits a "Higher High," but the OsMA histogram records a "Lower High." This suggests that the buyers are exhausted, and a downward correction is likely.
To trade these effectively, look for the OsMA bars to begin retreating toward the zero line after the divergence is spotted. This "hook" serves as the final confirmation to enter the trade.
Conclusion
The OsMA Divergence indicator is a must-have for traders who prioritize precision over volume. By focusing on the divergence between price and momentum, you can avoid buying at the very top or selling at the absolute bottom of a move. Integrate this tool into your technical analysis toolkit today to start catching reversals with renewed confidence.
8 Downloads
Last Update:
Apr 29, 2026 13:37 PM
Published:
Jan 31, 2026 02:41 AM
Category: