Mastering Trend Confluence: The Ultimate Guide to the Multy MA Indicator
In the world of technical analysis, moving averages are the bedrock of trend identification. However, relying on a single moving average can often lead to "whipsaws"—false signals that occur during market consolidation. To achieve true consistency, professional traders look for confluence. The Multy MA Indicator is a premier MT4 tool designed to provide this confluence by plotting multiple moving averages simultaneously, allowing traders to visualize the market’s structure across various depths of time and price.
What is the Multy MA Indicator?
The Multy MA is an advanced technical study that layers several moving averages into a single sub-window or onto the main chart. By using a "fan" or "rainbow" of averages, the indicator helps traders identify the strength and maturity of a trend. When the averages are fanned out and moving in the same direction, the trend is strong. When they converge or cross, a reversal or period of consolidation is likely imminent.
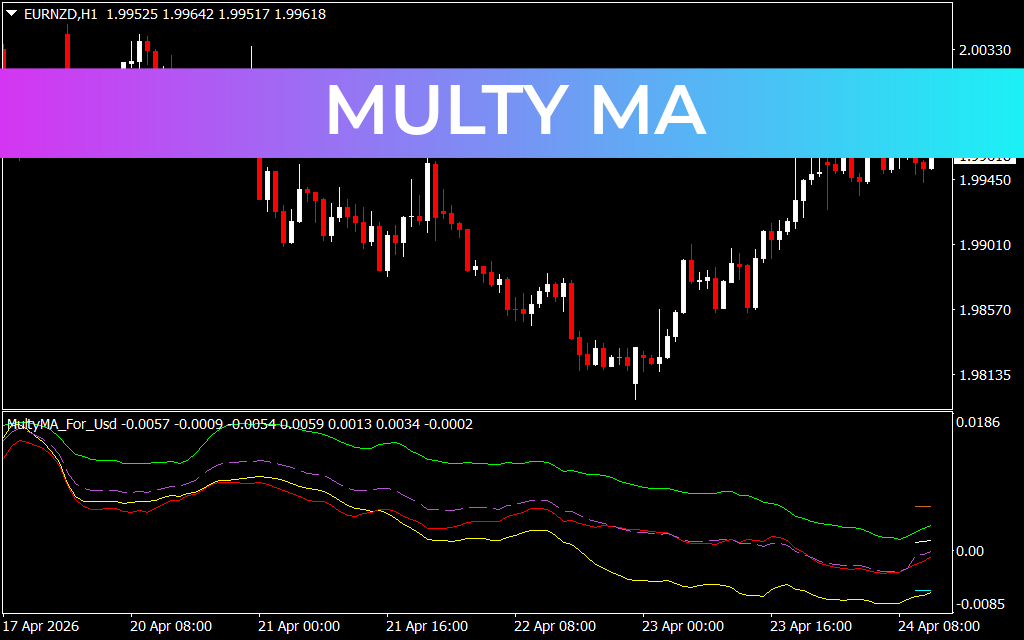
As seen in the EURNZD H1 chart, the Multy MA appears in a separate window as a series of colored lines (Green, Purple, Red, and Yellow). Each line represents a different period or calculation method (such as Simple, Exponential, or Weighted), providing a comprehensive view of short-term, medium-term, and long-term momentum in one glance.
Key Benefits of Multi-Layered Analysis
- Visual Trend Strength: The distance between the lines is a direct indicator of volatility and trend strength. A wide spread between the yellow (slow) and green (fast) lines indicates a powerful trending environment.
- Dynamic Support And Resistance: Rather than looking for a single price point, the Multy MA creates a "zone" of support or resistance. This is much more effective in volatile pairs like EURNZD, where price often pierces a single average before resuming the trend.
- Filtering Noise: By requiring multiple lines to align before entering a trade, the Multy MA naturally filters out the minor price fluctuations that often trigger false signals in solo-average systems.
- Precision Exit Strategy: When the fast lines begin to tuck back into the slow lines (contraction), it serves as an early warning to tighten stop losses or take profits before a full reversal occurs.
Strategic Implementation
To trade effectively with the Multy MA, look for Alignment Phases. In the provided H1 chart, notice how the lines are tightly bunched during the initial bearish move, but as the market bottoms out near April 23rd, the lines begin to cross and fan upward.
A high-probability "Buy" setup occurs when the fast lines (typically green/purple) cross above the slow lines (red/yellow) and all lines begin sloping upward. This indicates that momentum is shifting across all tracked time horizons. Conversely, a "Sell" setup is confirmed when the lines stack in descending order.
Whether you are a swing trader tracking H1 trends or a scalper looking for M1 momentum shifts, the Multy MA Indicator provides the structural clarity needed to stay on the right side of the market. By transforming simple averages into a sophisticated trend-following system, it gives you the mathematical edge required for long-term trading success.
1 Download
Last Update:
Apr 24, 2026 15:35 PM
Published:
Feb 03, 2026 02:22 AM
Category: