Unlocking Market Velocity with Momentum Indicators
In the world of Forex and stock trading, price movement alone doesn't tell the full story. To trade with a high probability of success, you need to understand the strength behind those movements. This is where Momentum Indicators come into play. By measuring the speed and change of price movements, these tools allow traders to identify when a trend is accelerating, when it’s losing steam, and—most importantly—when a reversal is imminent.
Understanding the Mechanics of Momentum
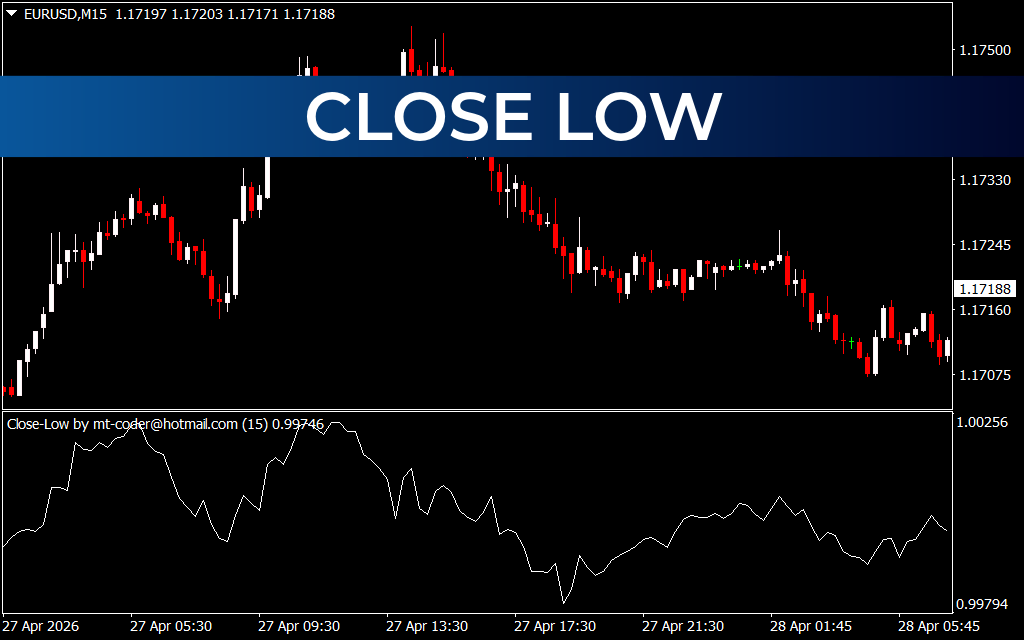
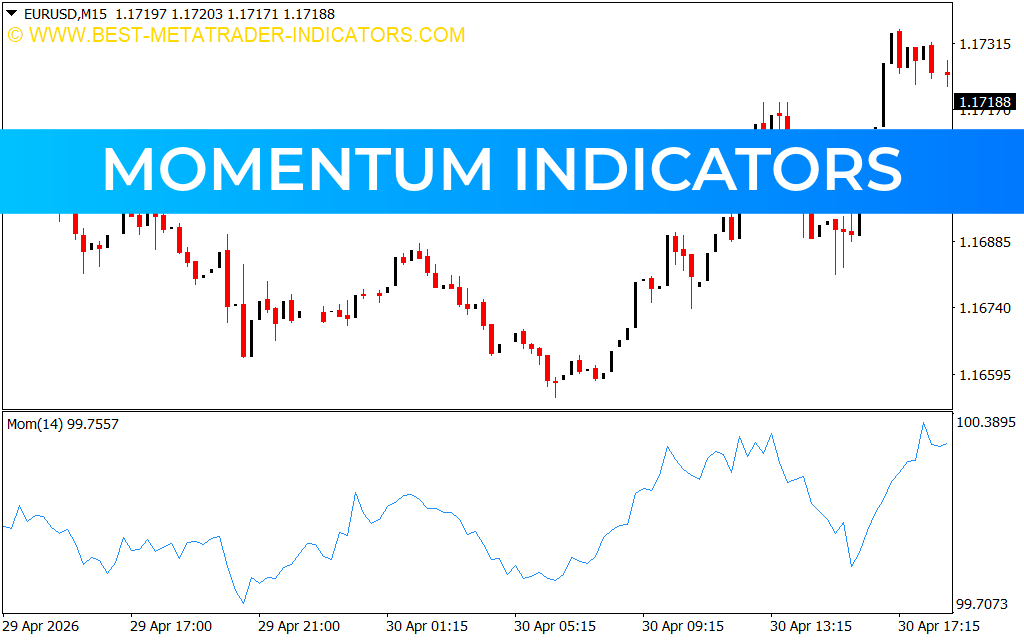
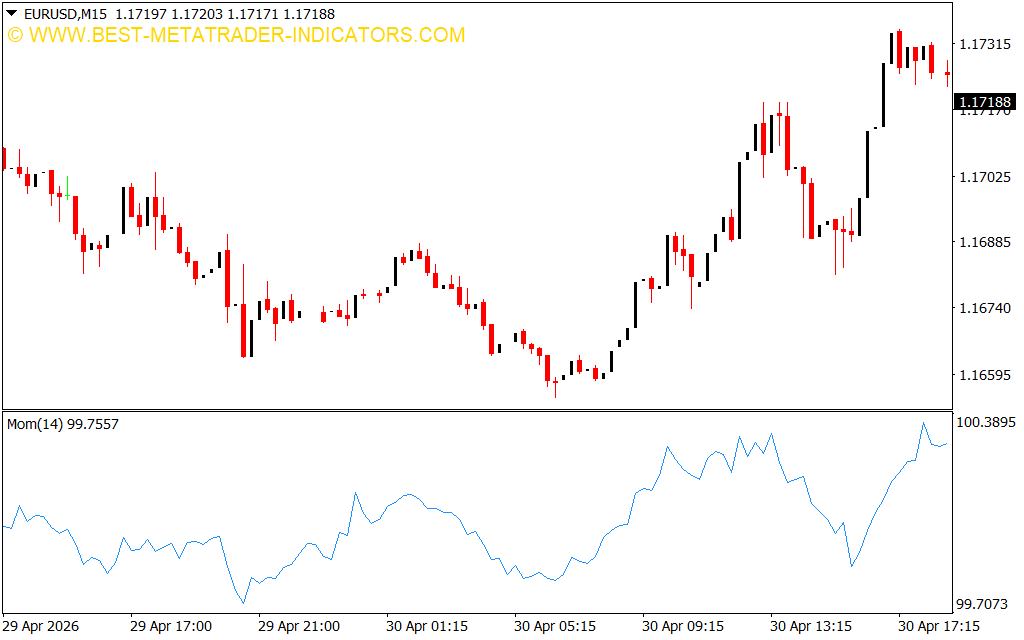
Momentum is a leading indicator, meaning it often changes direction before the price does. On the provided EUR/USD M15 chart, we see the Mom(14) indicator. This specific tool compares the current closing price to the closing price n periods ago. The resulting value oscillates around a center line (usually 100), providing a clear visual of the market's "pulse."
When the momentum line is rising and sits above the center line, it indicates that the bulls are in control and the upward trend is strengthening. Conversely, a falling line below the center suggests that bearish pressure is intensifying. As seen in the chart, as the EUR/USD price makes higher highs, the Momentum Indicator tracks this velocity, confirming the health of the bullish move.
Key Advantages of Trading with Momentum
- Early Warning Signals: Because momentum measures velocity, it can alert traders to a slowing trend through "divergence"—where the price makes a new high, but the indicator fails to do so.
- Overbought and Oversold Zones: Momentum indicators help identify extreme market conditions. When the line reaches a historical peak or trough, it suggests the market is overextended and a correction may be near.
- Trend Confirmation: It acts as a powerful filter. By only taking "Buy" signals when momentum is positive and increasing, you avoid entering weak trends that are likely to fail.
- Versatility Across Timeframes: Whether you are a 1-minute scalper or a weekly swing trader, momentum analysis remains consistent and effective.
Strategic Application: The Center Line Cross
One of the most reliable ways to utilize Momentum Indicators is the center-line crossover strategy. When the indicator crosses above the 100 line, it serves as a bullish trigger, suggesting that momentum has turned positive. When it dips below 100, it signals a shift toward bearish sentiment.
For even greater accuracy, seasoned traders often combine momentum with trend-following tools like moving averages. If the price is above a 200-period moving average and the momentum indicator crosses upward, you have a high-confluence setup that aligns with both the long-term trend and immediate market velocity.
Conclusion
The Momentum Indicator is a foundational tool for any technical analyst's toolkit. It moves beyond the "what" of Price Action to explain the "how fast," giving you a deeper look into the psychology of market participants. By mastering the nuances of momentum, you can time your entries with precision and stay on the right side of the market's most explosive moves.
2 Downloads
Last Update:
May 02, 2026 14:06 PM
Published:
Jan 29, 2026 12:57 PM
Category: