Navigate Market Trends with Precision Using the ADX Indicator for MT4
In the fast-paced world of technical analysis, the ability to distinguish between a strong trending market and a listless sideways range is what separates professional traders from the rest. The Average Directional Index (ADX) is a cornerstone technical indicator designed to quantify Trend Strength without regard to direction. Whether the market is climbing or falling, the ADX provides a mathematical foundation to help you decide if you should be riding the trend or staying on the sidelines.
What is the Average Directional Index (ADX)?
Developed by J. Welles Wilder, the ADX is a non-directional indicator that measures the intensity of a price move. It is typically derived from two other indicators: the Positive Directional Indicator (+DI) and the Negative Directional Indicator (-DI). While +DI and -DI tell you which way the market is moving, the ADX line itself tells you how strong that move is.
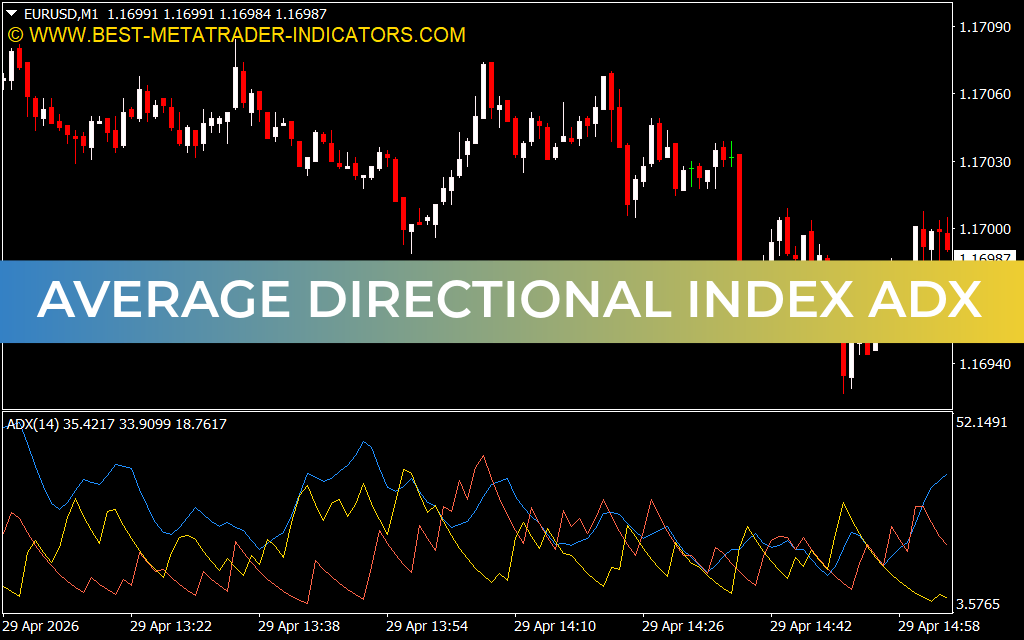
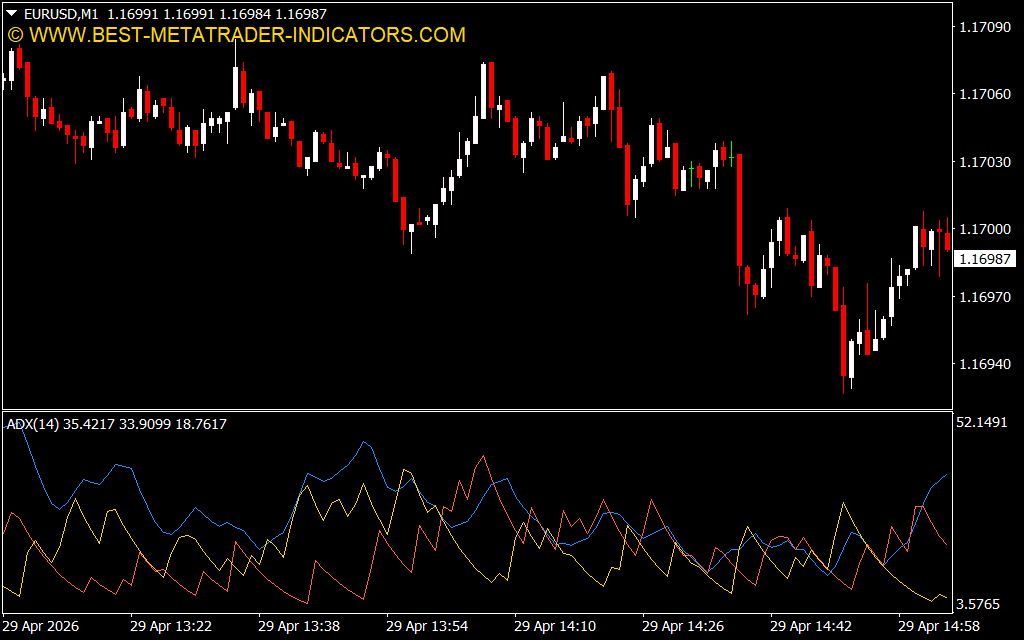
As shown in the EUR/USD M1 chart, the ADX typically oscillates in a sub-window between 0 and 100.
- The ADX Line (Blue/White): Represents the overall trend strength.
- The +DI Line (Yellow): Measures bullish momentum.
- The -DI Line (Red): Measures bearish momentum.
Quantifying Trend Strength
The ADX is unique because it provides a specific "grade" for market conditions:
- Below 20 (Non-Trending): When the ADX line falls below the 20 level, the market is usually in a "trading range" or accumulation phase. Trend-following strategies are often less effective here.
- Above 25 (Trend Initiation): A move above 25 signifies the birth of a trend. This is the "green light" for traders to look for entry points in the direction of the dominant DI line.
- Above 40 (Strong Trend): This indicates a very powerful trend. Professional traders often look to add to their positions or tighten their stop-losses during these periods.
- Above 50 (Extreme Trend): Trends at this level are often overextended, and a period of consolidation or a minor reversal is likely imminent.
Strategic Trading Applications
The ADX is an incredibly versatile utility that enhances any trading system:
- Filtering False Breakouts: Many traders get caught in "fakeouts" during sideways markets. By only taking breakout trades when the ADX is rising and above 20, you significantly increase your win rate.
- DI Crossovers: A classic signal occurs when the +DI crosses above the -DI while the ADX is rising. This confirms a bullish trend shift with enough momentum to sustain a move.
- Exit Optimization: When the ADX line begins to "hook" downward from an extreme peak (above 40), it suggests the trend is losing steam. This acts as an early warning to take profits before a major retracement begins.
Conclusion
The Average Directional Index is an essential asset for any MT4 user who wants to stop guessing and start measuring. By providing a clear, numerical value for trend intensity, it helps you allocate your capital to the most active and profitable market segments. Whether you are a day trader navigating M1 volatility or a swing trader looking for structural shifts, the ADX
2 Downloads
Last Update:
Apr 29, 2026 19:58 PM
Published:
Jan 30, 2026 20:04 PM
Category: