Profit from Volatility with the BB Squeeze Indicator
In the financial markets, Price Action typically moves through two alternating phases: expansion and contraction. While many traders chase the market during high-volatility expansions, the real professional edge lies in identifying the period of "calm" that precedes the storm. The BB Squeeze (Bollinger Band Squeeze) indicator is a world-class technical tool designed to pinpoint these periods of low volatility, allowing traders to position themselves before a massive breakout occurs.
What is the BB Squeeze Indicator?
The BB Squeeze is a momentum and volatility hybrid indicator based on the relationship between Bollinger Bands and Keltner Channels. Developed famously by John Carter, the "Squeeze" occurs when the Bollinger Bands (which measure standard deviation) fall inside the Keltner Channels (which measure Average True Range).
When the bands "squeeze" together, it signals that the market is in a period of extreme compression. Like a coiled spring, the longer the market stays in a squeeze, the more powerful the eventual breakout is likely to be.
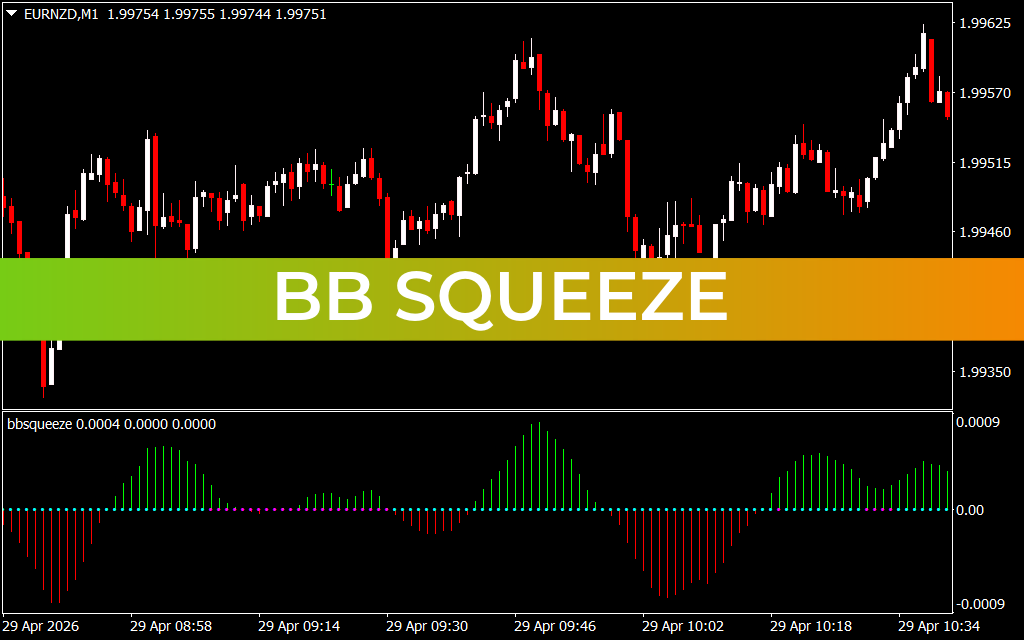
How to Read the BB Squeeze Histogram
The indicator typically appears in a sub-window as a series of dots and a momentum histogram:
- The Squeeze Dots: Usually, black or red dots on the zero line indicate that a squeeze is currently in effect (low volatility). When the dots turn green or gray, the squeeze has "fired," meaning volatility is expanding and a move is underway.
- The Momentum Histogram: The bars above or below the zero line indicate the direction and strength of the momentum.
- Blue/Cyan Bars: Rising momentum (Bullish).
- Red/Orange Bars: Falling momentum (Bearish).
Strategic Trading: Timing the Breakout
The beauty of the BB Squeeze indicator is that it tells you not just when to trade, but also the likely direction of the move.
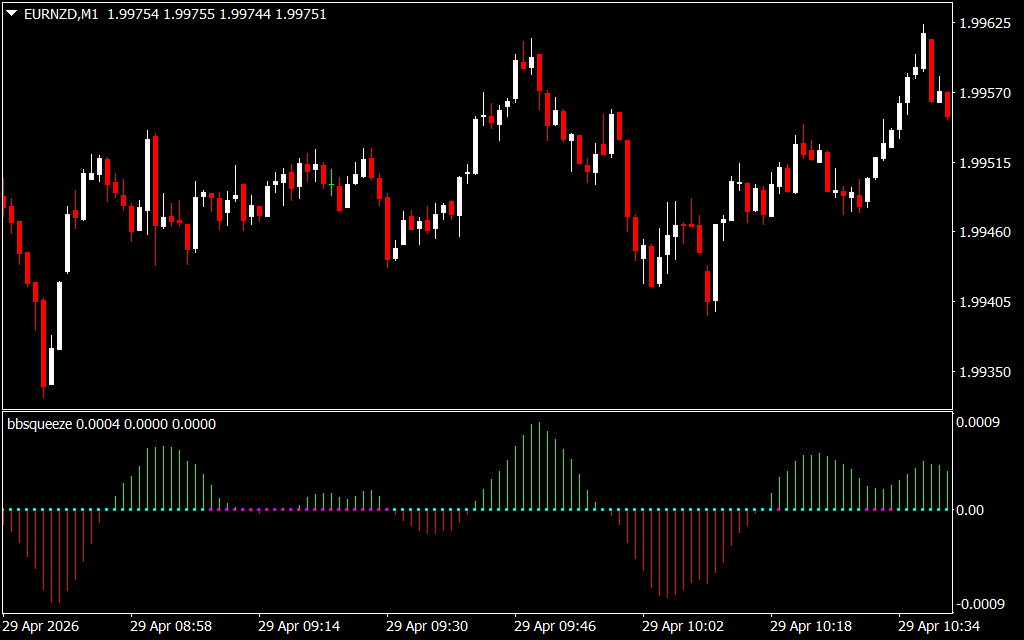
- Wait for the Squeeze: Look for a string of red dots on the M1 or M15 timeframe. This indicates the market is building energy.
- The Firing Signal: As soon as the dots change color, the squeeze is released.
- Directional Confirmation: If the histogram bars are cyan and rising during the release, it is a high-probability "Long" signal. If the bars are red and falling, it is a high-probability "Short" signal.
Why Every Scalper Needs the BB Squeeze
On lower timeframes like the M1, the market is filled with "fake" moves. The BB Squeeze filters these out by requiring a period of consolidation before a signal is generated. This ensures that you are entering the market when there is a genuine surge in institutional volume. It is an exceptional tool for trading major currency pairs like EUR/USD or EURNZD, especially during the London and New York session opens.
Conclusion
The BB Squeeze indicator is a foundational tool for any trader looking to capture explosive price movements. By identifying the transition from low to high volatility, it removes the guesswork from breakout trading. Whether you are a scalper looking for quick intraday bursts or a swing trader seeking the start of a new trend, the BB Squeeze provides the mathematical precision needed to stay ahead of the curve.
SEO Meta Description
1 Download
Last Update:
Apr 29, 2026 16:00 PM
Published:
Jan 30, 2026 22:35 PM
Category: