Master Market Trends with the Line Break Indicator
In the fast-paced world of technical trading, distinguishing between market "noise" and genuine trend movements is a constant challenge. Standard candlestick charts can often be misleading, showing erratic price spikes that lack true momentum. The Line Break Indicator for MT4 and MT5 offers a superior alternative. By focusing exclusively on price direction rather than time, this indicator helps traders cut through the clutter and identify high-probability trend shifts with remarkable clarity.
What is the Line Break Indicator?
The Line Break chart—often referred to as "Three Line Break"—is a classic Japanese charting technique that strips away the time element. Instead of printing a new candle every few minutes, the Line Break indicator only plots a new bar (or "line") when the price moves by a specific, significant amount.
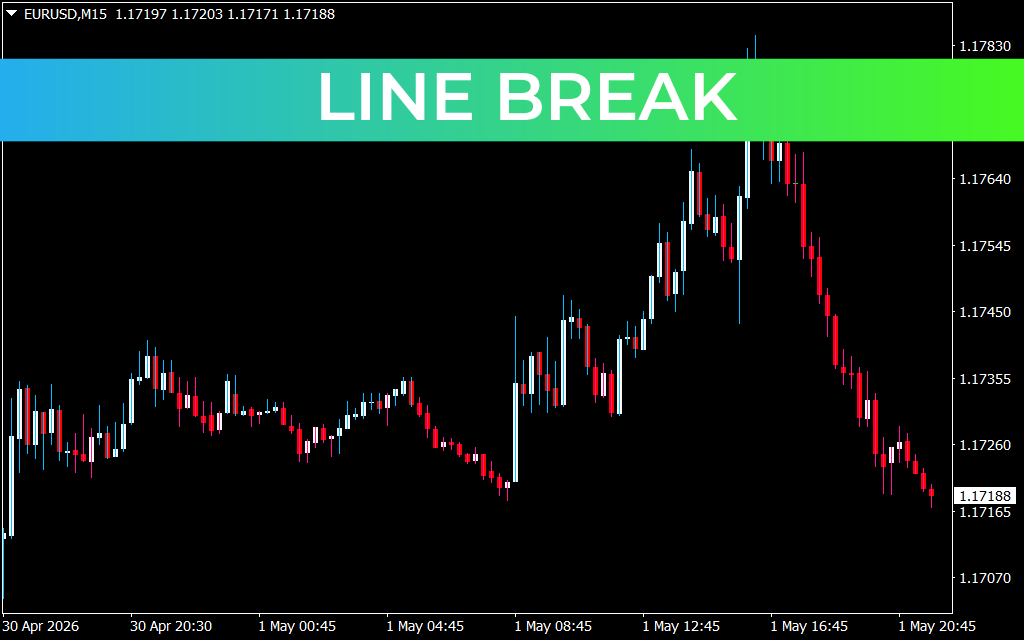
As shown in the provided EUR/USD chart, the indicator creates a series of colored blocks:
- Blue/Green Blocks: Represent bullish momentum, appearing when price closes above a previously defined high.
- Red Blocks: Represent bearish momentum, appearing when price closes below a previously defined low.
By filtering out insignificant price jitter, the Line Break indicator allows you to see the market's "pure" direction. This is especially useful for trend-following strategies, where the goal is to remain in a position as long as the market momentum supports your trade.
Why Traders Choose Line Break
The Line Break indicator is a favorite among professional traders because it excels at solving common trading pitfalls:
- Elimination of Noise: Unlike time-based charts that print bars regardless of market activity, Line Break bars only move when price makes a significant change. This keeps your focus on actual market movement, not just the passing of time.
- Objective Trend Signals: The color-coded system provides a clear, mechanical signal. When the trend changes from bullish (blue) to bearish (red), it gives you an objective trigger to exit your long positions or initiate a short.
- Simplified Charting: By removing the need for complex, indicator-heavy setups, Line Break provides a clean, professional aesthetic. It allows you to focus on the structure of the market rather than over-analyzing multiple overlapping indicators.
- Versatility: Whether you are Scalping the M5 timeframe or swing trading for long-term gains, the Line Break logic scales perfectly, adapting to the volatility of the asset you are trading.
Strategic Application
To get the most out of the Line Break indicator, use it to define your entry and exit points. A high-probability "Buy" setup occurs when a sequence of red blocks is broken by a new blue block, signaling that the sellers have been exhausted and buyers have taken control. Conversely, use a new red block as your signal to exit a long position or enter a short. By relying on this objective, price-driven methodology, you remove the emotional stress that often leads to trading errors. Add the Line Break indicator to your toolkit today to refine your analysis and trade with renewed confidence.
1 Download
Last Update:
May 02, 2026 22:43 PM
Published:
Jan 28, 2026 23:06 PM
Category: