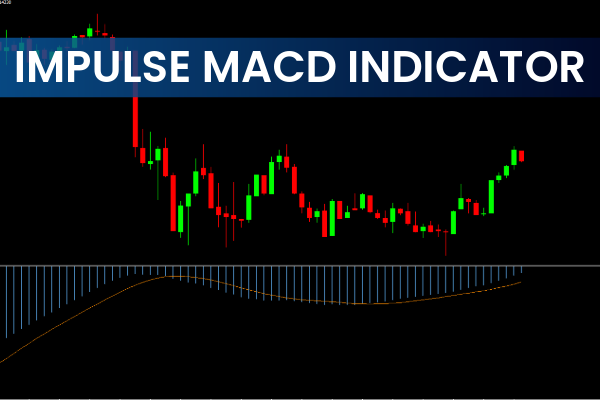
The Impulse MACD Indicator is a powerful trend-momentum tool widely used by forex and stock traders. As an enhanced version of the traditional MACD, it combines moving average filters and momentum histogram analysis to provide accurate trading signals. Traders use the Impulse MACD Indicator to identify market direction, detect trend reversals, and spot entry and exit opportunities with better precision. In this guide, you’ll learn how the indicator works, how to trade with it, and why it’s valuable for MT4 traders.
How the Impulse MACD Indicator Works
The Impulse MACD Indicator for MT4 uses a two-step filtering system to interpret Price Action more clearly.
Moving Average Filter
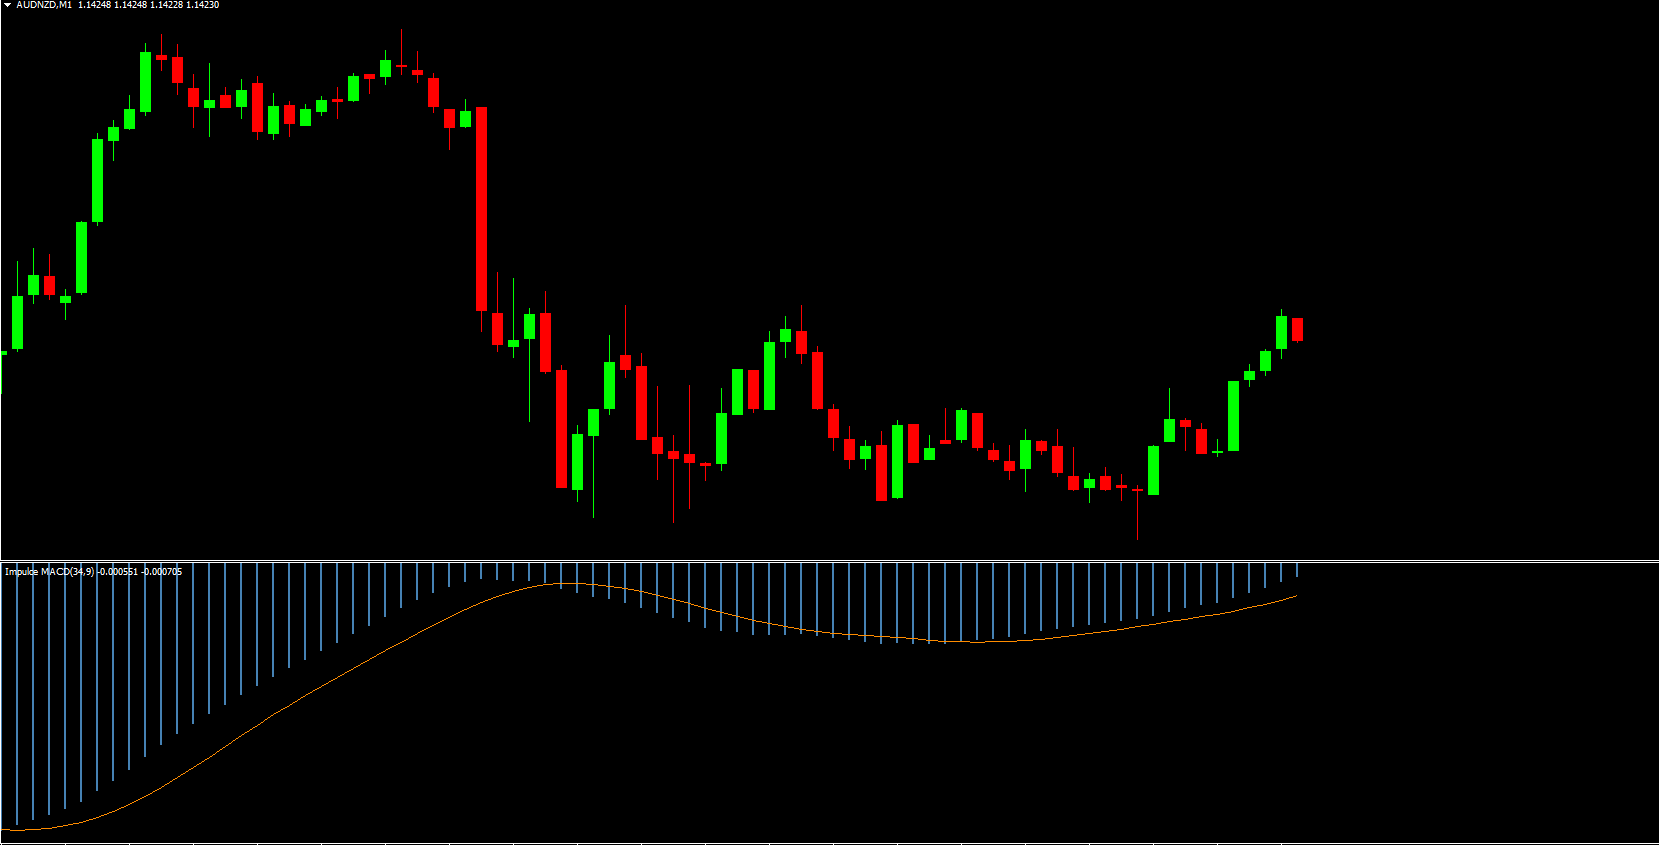
The first filter is a moving average line designed to smooth price movements. This helps traders see the primary trend direction without noise. When the price consistently sits above this line, the market typically shows bullish momentum; when below, bearish pressure dominates.
Histogram Momentum Filter
The second component is the histogram bar. This bar reflects the difference between the MACD line and the signal line. A rising histogram shows growing momentum, while a declining one indicates weakening Trend Strength. Together, these filters help traders visualize market shifts more accurately.
Benefits of Using the Impulse MACD Indicator
Clear Trend Identification
The indicator eliminates chart noise, offering a cleaner view of whether the market is trending or ranging.
Momentum Recognition
With its histogram design, traders can easily identify increasing or decreasing market momentum.
User-Friendly for Beginners
Unlike advanced oscillators, the Impulse MACD is simple, intuitive, and perfect for new traders learning technical analysis.
Works Across Multiple Timeframes
Higher timeframes like H4 and Daily tend to produce high-quality signals, making the indicator suitable for swing trading and long-term analysis.
How to Trade Using the Impulse MACD Indicator (MT4 Guide)
Bullish Trading Setup
A bullish signal appears when:
The MACD moving average line crosses above the zero level and stays above it.
The histogram bars close above the moving average line.
Bars show a rising pattern, confirming upward momentum.
This behavior suggests the trend is shifting upward, offering a potential buy opportunity.
Bearish Trading Setup
A bearish signal is created when:
The MACD moving average line remains below the zero level.
Histogram bars close below the moving average line.
Bars display a falling pattern, confirming downward momentum.
This combination indicates a strong bearish trend, suitable for sell setups.
Real-Chart Example: GBP/USD Analysis
In the GBP/USD chart example, the histogram bars closed below the zero line, signaling bearish momentum. As bars began closing below the signal line, the market confirmed a Trend Reversal. Price later broke below a consolidation range, validating the downtrend. This scenario presented an ideal sell opportunity.
When the bars eventually closed above the signal line, it suggested weakening bearish momentum—an ideal place to exit the sell trade.
Best Practices for the Impulse MACD Indicator
Combine With Other Indicators
For higher accuracy, traders pair the Impulse MACD Indicator with RSI, Stochastic Oscillator, or moving averages. These tools help confirm signals and reduce false entries.
Use Higher Timeframes
H4 and Daily charts often yield cleaner and more reliable Impulse MACD signals.
Stick to Trend Trading
This indicator performs best in trending markets. Avoid using it alone during strong ranging periods.
Conclusion
The Impulse MACD Indicator for MT4 is a reliable, beginner-friendly tool that simplifies trend and momentum analysis. Its dual-filter system helps traders spot potential market reversals and identify high-probability trade setups. Whether you’re new to trading or refining your strategy, this improved MACD version can significantly enhance your technical analysis.
To download more high-quality trading indicators and tools, visit IndicatorForest.com today.
FAQ
1 Download
Published:
Nov 25, 2025 22:02 PM
Category: