The II SupDem Indicator MT4 is a simple yet powerful tool that highlights Supply And Demand zones in the forex market. The acronym “SupDem” stands for supply and demand, which are key concepts in price action trading. This indicator allows traders to visualize potential support and resistance levels and helps identify areas where price reversals or strong moves may occur.
Unlike traditional Support And Resistance lines, the II SupDem indicator dynamically plots zones based on significant market activity. Whenever there is high trading volume or a major volatility spike, the indicator marks supply and demand zones on the chart. These zones help traders anticipate market reactions before entering trades.
Understanding Supply and Demand Zones
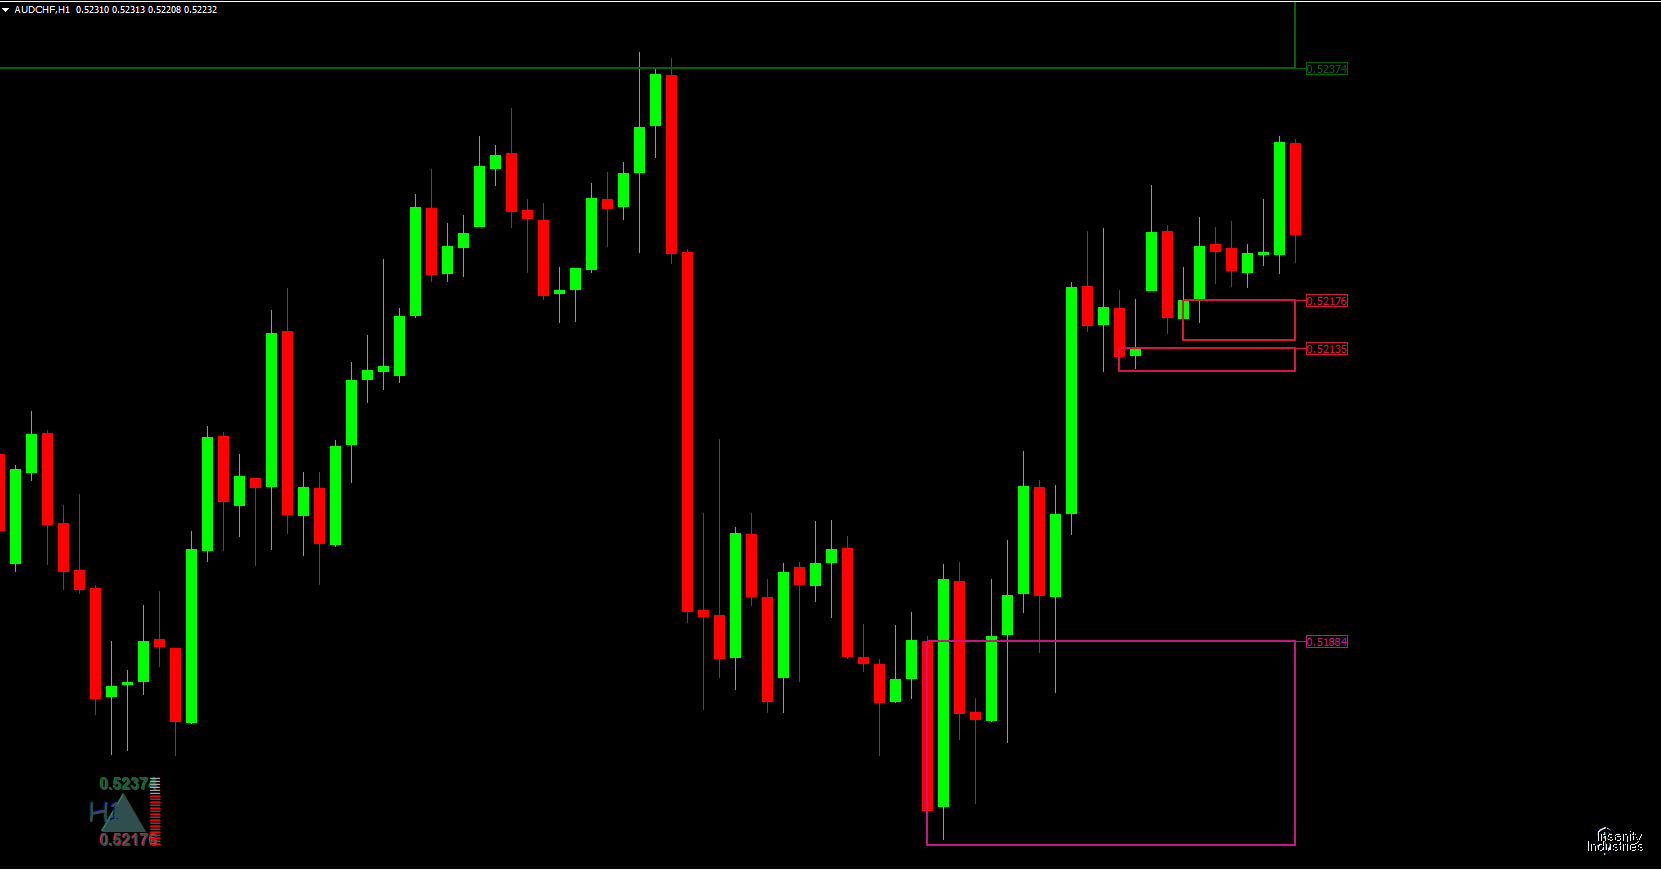
The II SupDem Indicator MT4 uses color-coded zones to make reading the chart intuitive:
Green zones: Represent demand areas where buyers may step in. These zones indicate potential upward pressure.
Red zones: Represent supply areas where sellers dominate, signaling possible price declines.
By observing these zones, traders can gauge potential reversal points and adjust their positions accordingly.
Trend Meter Feature
In addition to supply and demand zones, the II SupDem indicator features a trend meter. The meter provides a quick overview of market sentiment:
Upward arrow with green lines: Indicates a bullish trend.
Downward arrow with red lines: Indicates a bearish trend.
This trend meter helps traders align their entries with the prevailing market direction, increasing the probability of successful trades.
Using II SupDem for Trading
While the II SupDem Indicator MT4 does not provide explicit BUY or SELL signals, traders can combine it with other tools for effective trade setups. Observing the appearance of supply and demand zones can guide traders to:
Enter long positions: When price approaches a red supply zone, signaling buyers may dominate.
Enter short positions: When price approaches a green demand zone, signaling potential selling pressure.
Additionally, the indicator plots weaker supply and demand zones in different colors. These weaker zones suggest caution, as price may continue in its current direction before reacting strongly.
Example: GBP/USD H4 Chart
On a GBP/USD H4 chart, the II SupDem indicator shows a green zone at a previous high, indicating a potential reversal. Traders observing this zone may prepare for a short position if price reaches the zone and shows signs of reversal. Similarly, a red zone at a previous low may indicate a buying opportunity when price approaches this level. Combining these zones with Price Action or other indicators like MACD or RSI can improve trade accuracy.
How to Use a Supply and Demand Indicator
The II SupDem Indicator MT4 functions as a supply and demand tool by highlighting zones similar to traditional support and resistance levels. Traders can use these zones to plan entries, stop losses, and take profit areas. Observing how price reacts to these zones provides insights into market strength and potential reversals.
Benefits of the II SupDem Indicator
Highlights supply and demand zones dynamically
Provides an easy-to-read trend meter
Works on both short-term and long-term timeframes
Helps traders identify potential reversal points
Free to download and simple to use
Conclusion
The II SupDem Indicator MT4 is an essential tool for forex traders looking to incorporate supply and demand analysis into their strategy. With dynamic zone plotting, trend meter visualization, and clear market insights, traders can better plan entries and exits. Although the indicator does not provide explicit BUY or SELL signals, combining it with other technical tools makes it highly effective for both short-term and long-term trading. Download this free MT4 indicator today at IndicatorForest.com to enhance your trading toolkit.
FAQ
1 Download
Published:
Nov 24, 2025 03:21 AM
Category: