Master Market Trends with Moving Average Candlesticks
In the fast-paced world of Forex and stock trading, clarity is the difference between a winning trade and a costly mistake. Standard candlestick charts provide the raw data, but they often lack the immediate context needed to filter out market noise. This is where Moving Average Candlesticks come into play—a powerful technical indicator designed to merge Price Action with trend momentum directly on your price bars.
What are Moving Average Candlesticks?
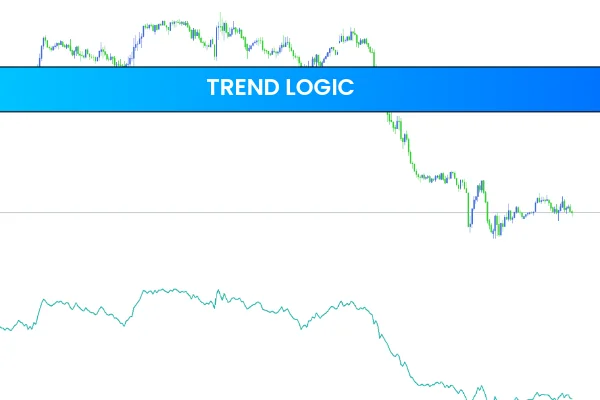
Moving Average Candlesticks are a hybrid charting tool that colors or modifies traditional candles based on their relationship to a specific Moving Average (MA). Unlike a standard line overlay that sits on top of your chart, this indicator integrates the trend logic into the candles themselves.
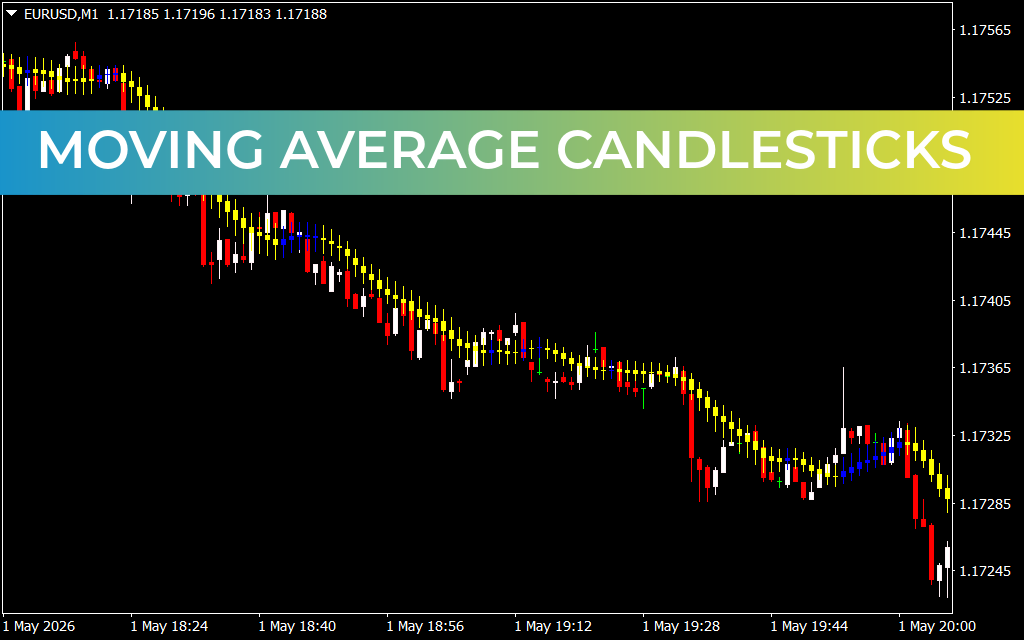
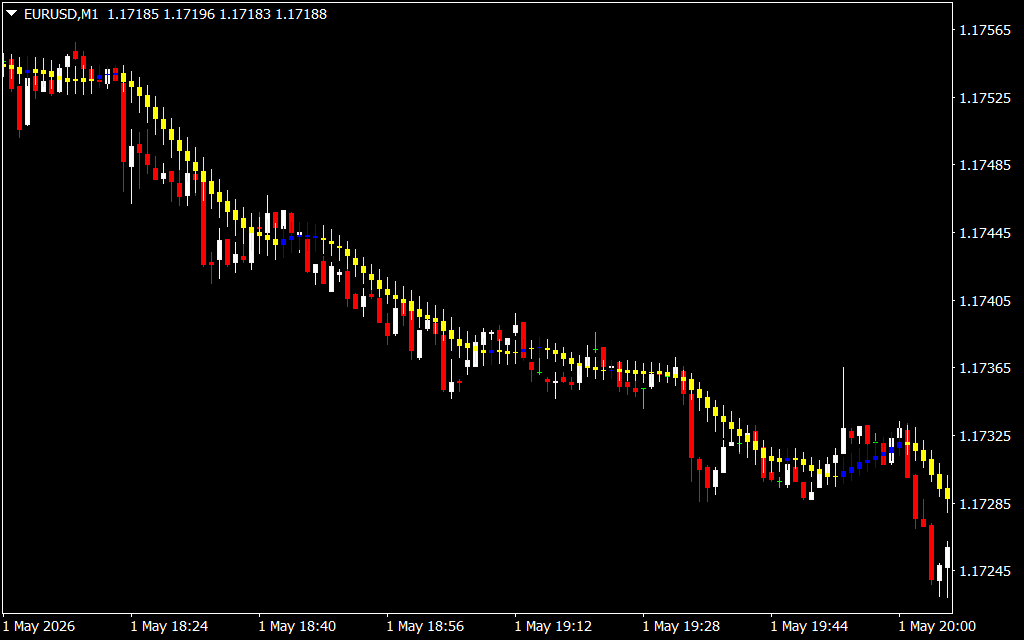
When the price is trending upward relative to the MA, the candles shift to a "bullish" color (often blue or green); when the price drops below the average or the momentum shifts, the candles change to a "bearish" color (red or yellow). This provides a seamless visual representation of the prevailing market sentiment without cluttering your workspace.
Why Every Trader Needs This Visual Edge
The primary struggle for many traders, especially those Scalping on 1-minute (M1) or 5-minute (M5) timeframes, is emotional reactivity to minor price fluctuations. Moving Average Candlesticks solve this through:
- Instant Trend Identification: You no longer need to squint at a lagging line. If the candles are yellow/red, you are in a downtrend. If they are blue/white, the bulls are in control.
- Noise Reduction: By focusing on the average price over a set period, the indicator ignores "fake-out" spikes that don't represent a true shift in momentum.
- Improved Entry and Exit Timing: Traders often use the color change as a primary signal. A shift from red to blue can indicate the start of a reversal, allowing you to enter early with high confidence.
Strategy Integration: The M1 Scalper’s Dream
As seen in high-frequency environments like the EUR/USD M1 chart, Moving Average Candlesticks excel at highlighting "runs." In a strong downtrend, the indicator maintains a consistent bearish color even during small retracements. This prevents traders from exiting a profitable short position too early.
To maximize results, combine this indicator with a secondary filter, such as a Relative Strength Index (RSI) or MACD. When the candlesticks change color and align with an oversold/overbought reading, the probability of a successful trade increases exponentially.
Conclusion
Whether you are a seasoned professional or a beginner, the Moving Average Candlesticks indicator simplifies the complex. It turns raw data into an intuitive map of the market, allowing you to trade with the trend, reduce mental fatigue, and capture larger moves with precision.
5 Downloads
Last Update:
May 02, 2026 13:28 PM
Published:
Jan 29, 2026 18:14 PM
Category: