Master Daily Market Structure with the I-Intra Day Indicator
In the fast-paced realm of day trading, the most significant price levels aren't always found on a moving average or a stochastic oscillator. Instead, they are often defined by the market's own structural history within a single trading session. The I-Intra Day Indicator is a sophisticated structural tool for MetaTrader 4, designed to automatically map out the "zones of interest" that institutional traders use to frame their daily bias.
Download I-Intra Day Indicator for free. Automatically map market structure and identify high-probability intraday Support And Resistance levels.
Visualizing Intraday Support and Resistance
The I-Intra Day Indicator functions by identifying critical swing points—highs and lows—that occur throughout the trading day. Unlike static pivot points, this indicator is dynamic, drawing trendlines and horizontal levels that adapt as new price data is printed. By visualizing these levels, traders can see exactly where the market has found "value" and where it has faced rejection.
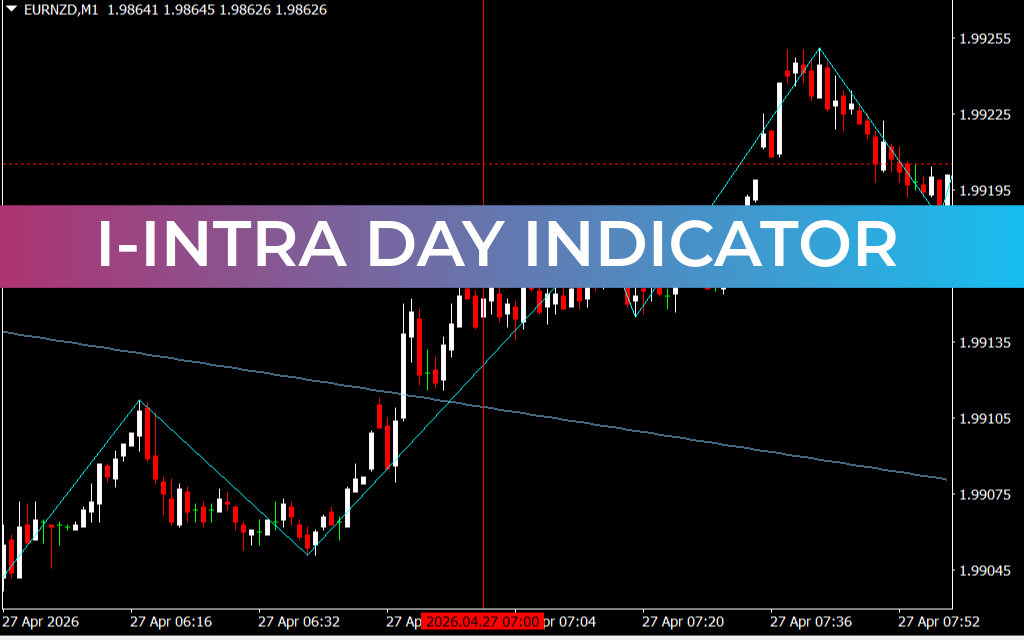
As illustrated in the EURNZD M1 chart, the indicator uses a series of light blue trendlines to connect significant peaks and troughs. These lines create a structural "web" that highlights:
- Trend Acceleration: When price breaks above a descending structural line, it signals a potential shift from bearish to bullish sentiment.
- Dynamic Support: Previous peaks that were broken often act as new floors for the price, providing high-probability "buy the dip" opportunities.
- Market Symmetry: The indicator often reveals geometric patterns in Price Action that are invisible to the naked eye, helping traders anticipate where the next reversal might occur.
Strategic Execution for Scalpers
For traders operating on the M1 or M5 timeframes, the I-Intra Day Indicator serves as a vital roadmap. In a "noisy" market, it is easy to lose sight of the bigger picture. The I-Intra Day tool keeps you grounded in the current session's reality.
- Breakout Confirmation: Instead of guessing if a move is real, wait for a candle to close outside the structural lines plotted by the indicator. This provides a clear, rule-based entry signal.
- Target Selection: The projected lines and historical horizontal levels act as natural magnets for price. Traders can use these as objective take-profit targets, ensuring they exit before a major structural reversal.
- Risk Management: By placing stop-losses just beyond the most recent structural swing point identified by the indicator, traders can achieve superior risk-to-reward ratios.
The Professional Edge in Daily Trading
The brilliance of the I-Intra Day Indicator lies in its ability to simplify complex price action into a readable framework. It doesn't use lagging mathematical formulas; it uses the actual price history of the current session. This makes it an essential companion for price action enthusiasts and technical analysts alike.
Whether you are trading the London open or the New York close, the I-Intra Day Indicator ensures you are never trading "blind." It gives you the structural context required to compete with institutional algorithms, allowing you to identify the path of least resistance and execute your trades with professional precision and confidence.
8 Downloads
Last Update:
Apr 27, 2026 15:20 PM
Published:
Feb 01, 2026 19:50 PM
Category: