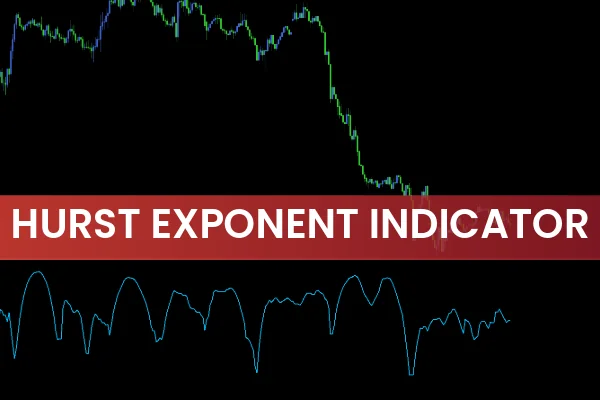
The Hurst Exponent Indicator for MetaTrader 5 (MT5) is a time-series analysis tool that measures the “memory” or persistence of an asset’s price movements. By analyzing the correlation between consistent and inconsistent price behavior, it provides traders with valuable insight into whether the market is trending or moving sideways.
This unique indicator is widely used by traders, data scientists, and quantitative analysts because it helps forecast price behavior patterns rather than just reacting to past market data. Whether you are a scalper, day trader, or swing trader, the Hurst Exponent Indicator provides an effective framework for understanding market dynamics and volatility.
How the Hurst Exponent Indicator Works
The Hurst Exponent (H) value typically ranges between 0 and 1, representing the degree of persistence in price movements:
H < 0.5: Indicates a mean-reverting or ranging market. Prices are likely to revert to the mean, signaling sideways movement.
H ≈ 0.5: Suggests a random walk—price movements are unpredictable and lack a clear trend.
H > 0.5: Indicates a trending market—prices tend to continue in the current direction, whether bullish or bearish.
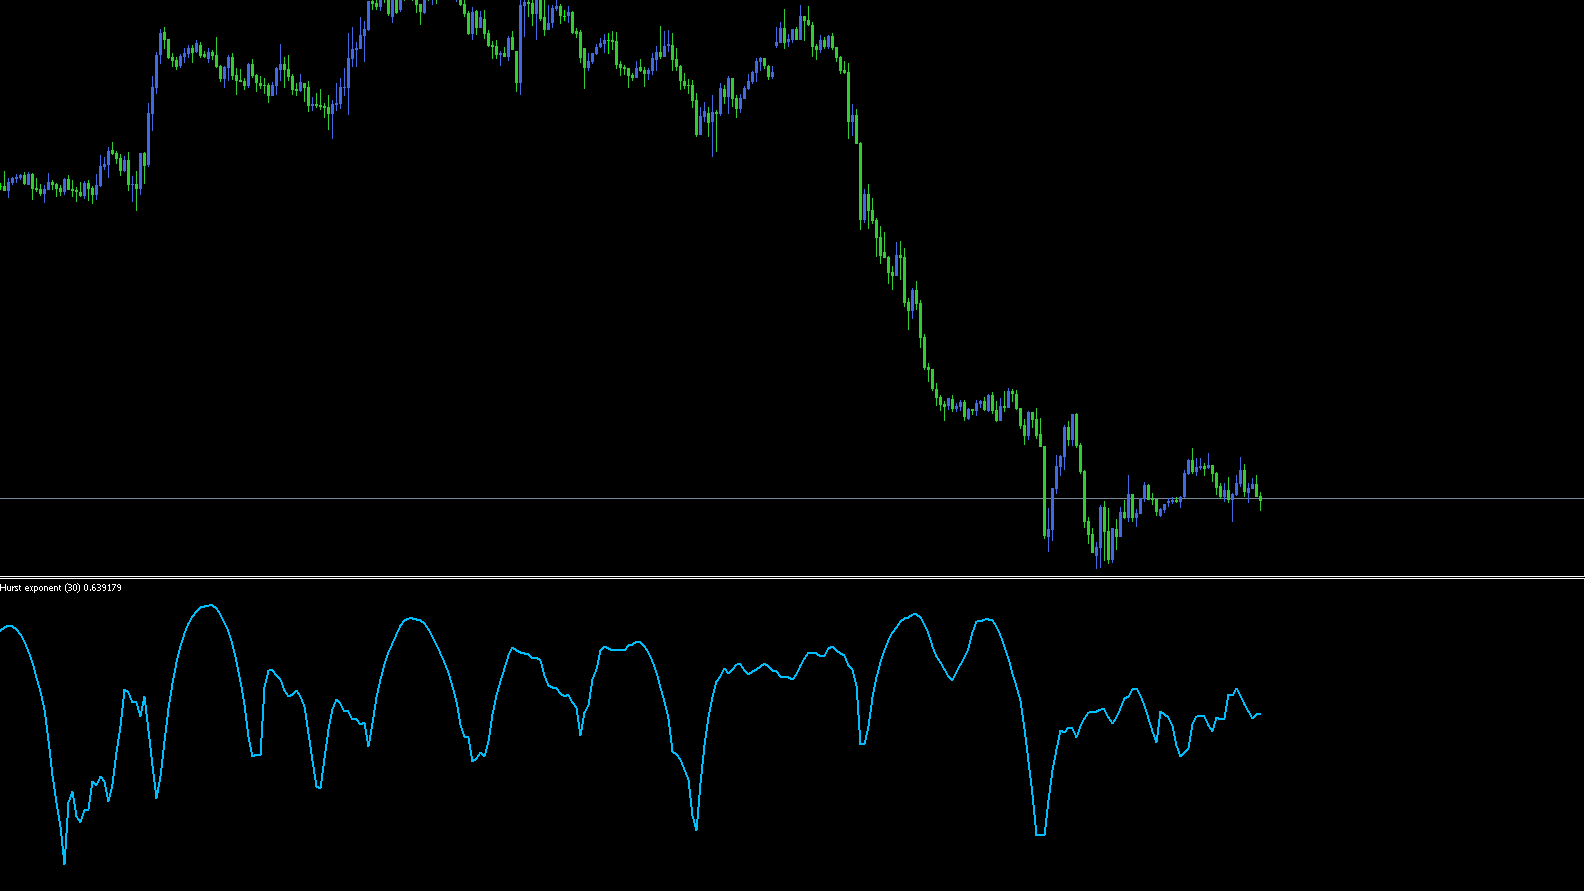
The indicator plots a blue line in a separate window below your main MT5 chart. This line fluctuates based on market conditions, helping traders quickly determine whether an asset is trending or ranging.
Key Interpretation
Above 0.6: The market is trending (either bullish or bearish).
Below 0.6: The market is ranging or moving sideways.
This simple yet powerful analysis helps traders decide when to trade breakouts or avoid choppy price conditions.
How To Trade Using the Hurst Exponent Indicator
While the Hurst Exponent Indicator doesn’t generate direct buy or sell signals, it serves as a market condition filter to enhance strategy performance.
Trading During Trending Markets (H > 0.6)
When the blue line rises above 0.6, it signals a trending environment.
If Price Action confirms higher highs and higher lows → look for buy opportunities.
If price action confirms lower highs and lower lows → look for sell opportunities.
Combine with moving averages or trend-following indicators (e.g., MACD, ADX) to confirm direction.
Trading During Ranging Markets (H < 0.6)
When the blue line falls below 0.6, it indicates sideways or consolidating conditions.
Avoid entering new trades until a breakout occurs.
Use oscillators like RSI or Stochastic to identify overbought/oversold zones within the range.
Consider range-bound strategies such as buying at support and selling at resistance.
Avoid Overtrading in Uncertain Zones
When the indicator fluctuates close to 0.5, it means the market lacks clear direction. In such cases, it’s best to stay out of the market until a decisive trend forms.
Advantages of the Hurst Exponent Indicator for MT5
Identifies Trend vs. Range: Helps traders filter trades by determining if the market is trending or consolidating.
Adapts to All Market Conditions: Works across forex, stocks, indices, and commodities.
Enhances Strategy Precision: Provides a statistical foundation for trading strategies.
Simple and Visual: The single-line display makes market analysis quick and easy.
Ideal for All Traders: Suitable for beginners, intraday traders, and long-term investors.
Best Settings and Tips
Timeframes: Works best on H1, H4, and Daily charts.
Combine With:
Moving Averages – to confirm trend direction.
RSI or Stochastic Oscillator – for entry timing in ranging markets.
ADX (Average Directional Index) – to strengthen Trend Confirmation.
Asset Classes: Forex, indices, stocks, and cryptocurrencies.
By combining the Hurst Exponent with traditional indicators, traders can avoid false signals and improve their overall risk-reward ratio.
Conclusion
The Hurst Exponent Indicator for MT5 is a robust analytical tool that measures market persistence to determine whether the price is trending or ranging. It provides statistical insight into market behavior, making it a powerful addition to any trading strategy.
By understanding when the market is likely to trend or consolidate, traders can avoid low-probability setups and focus on high-quality opportunities.
Download the Hurst Exponent Indicator for MT5 for free at IndicatorForest.com and start using it to enhance your market analysis and trading precision.
FAQ
6 Downloads
Published:
Nov 07, 2025 02:48 AM
Category: