Elevating Market Analysis with the Fractal Adjustable Lookback Indicator
In the pursuit of technical mastery, traders often grapple with the concept of "Market Structure." Understanding where a trend begins, pauses, and reverses is the foundation of any profitable strategy. While Bill Williams popularized the standard fractal—a five-bar pattern indicating a local high or low—the Fractal Adjustable Lookback indicator takes this concept to a professional level by offering unparalleled customization for modern, volatile markets.
What is the Fractal Adjustable Lookback?
A traditional fractal is a rigid geometric pattern where the middle candle has the highest high or lowest low of the surrounding five bars. However, markets are not always so uniform. The Fractal Adjustable Lookback indicator allows traders to modify the "lookback" period, essentially choosing how many candles must be compared to define a significant swing point.
By adjusting the lookback, you can filter out minor price fluctuations and focus only on major structural pivots. This flexibility makes the indicator indispensable for traders who move between different market environments, from high-frequency Scalping to long-term position trading.
The Power of Dynamic Pivot Points
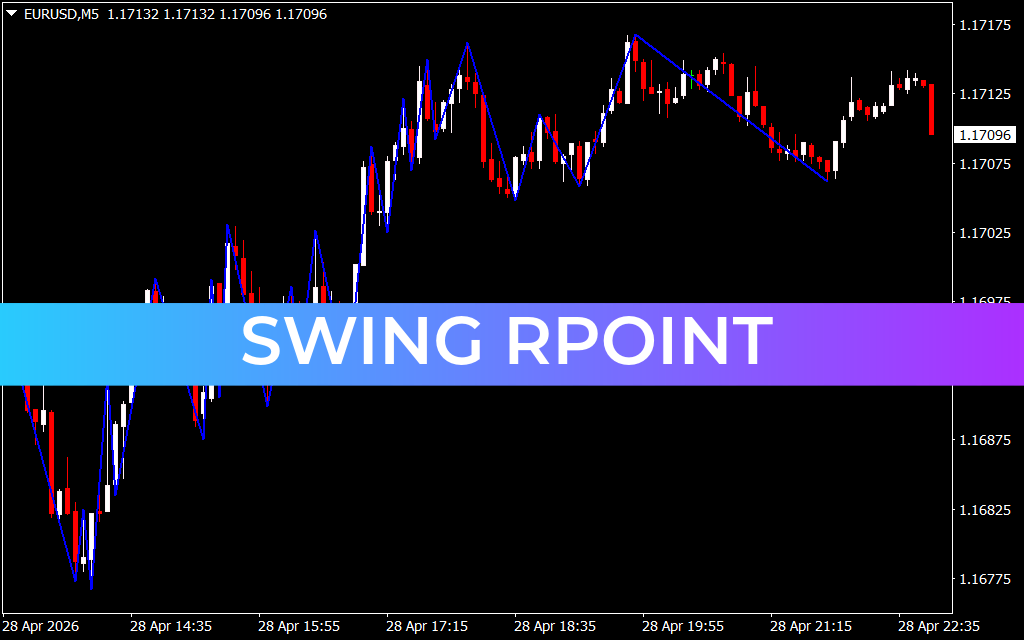
The primary strength of this indicator is its ability to map out Support And Resistance levels in real-time.
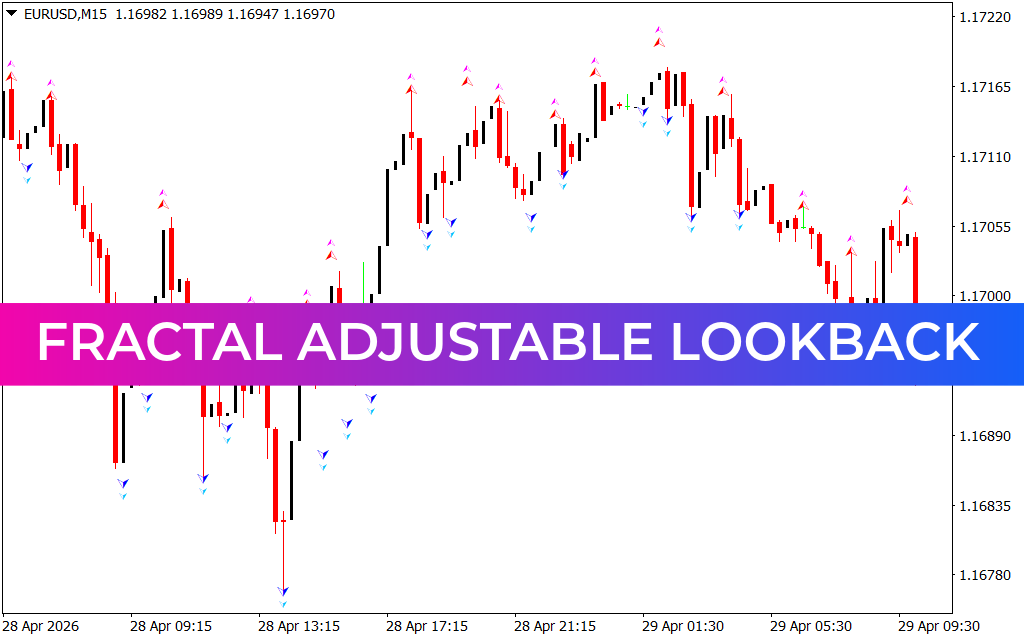
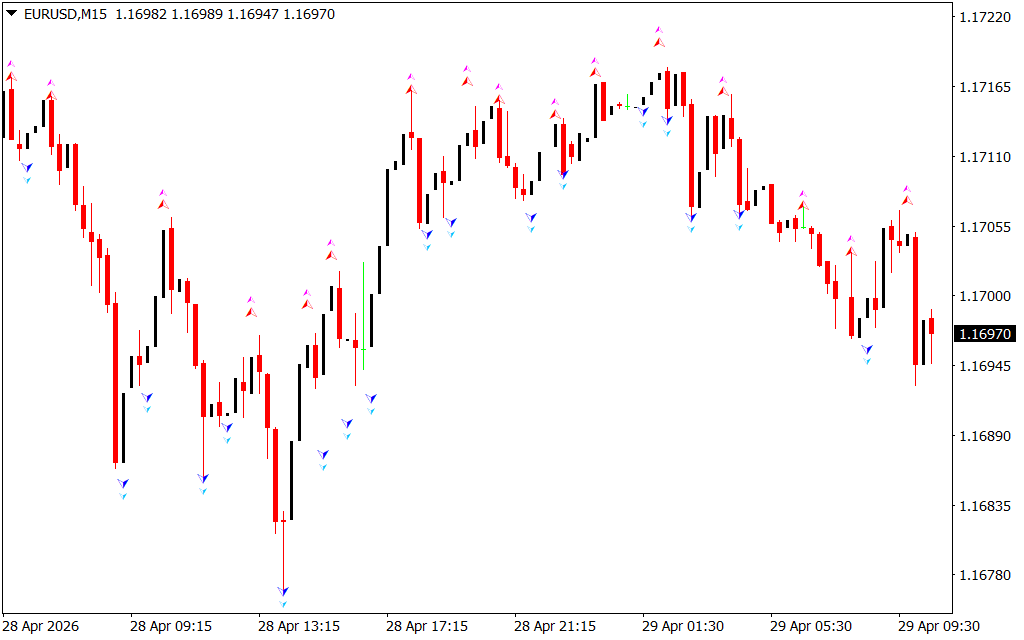
- Upward Fractals (Resistance): These appear above a candle when the market has reached a temporary peak. They signal that sellers are entering the market or buyers are taking profits.
- Downward Fractals (Support): These appear below a candle when the market has hit a floor. They indicate a potential area where demand is overwhelming supply.
Unlike static support lines, these adjustable fractals move with the Price Action, providing a dynamic map of the market's "battleground" areas.
How to Trade with Adjustable Fractals
The Fractal Adjustable Lookback is a versatile tool that excels in several strategic applications:
- Breakout Confirmation: One of the most effective ways to trade fractals is to wait for price to break through a recent fractal high or low. An adjustable lookback ensures that the breakout is occurring against a significant level, reducing the risk of being caught in a "fakeout."
- Trend Alignment: In a healthy uptrend, the market should consistently create higher upward fractals and higher downward fractals. If the market fails to break a previous upward fractal, it serves as an early warning of a trend exhaustion.
- Stop-Loss Placement: Many professional traders use the most recent fractal (on an adjusted lookback) as a logical place to set their stop-loss. This ensures the stop is protected by a verified structural pivot.
Customization for Every Timeframe
On an M15 chart, a shorter lookback might be preferred to capture quick intraday swings. On a Daily chart, increasing the lookback helps identify major institutional turning points. This indicator empowers the trader to decide what constitutes a "significant" move, rather than relying on a one-size-fits-all mathematical default.
Conclusion
The Fractal Adjustable Lookback indicator is more than just a signal generator; it is a lens through which you can view market structure with absolute clarity. By allowing you to define the scale of your analysis, it bridges the gap between chaotic price action and disciplined technical trading.
7 Downloads
Last Update:
Apr 29, 2026 13:44 PM
Published:
Jan 31, 2026 02:29 AM
Category: