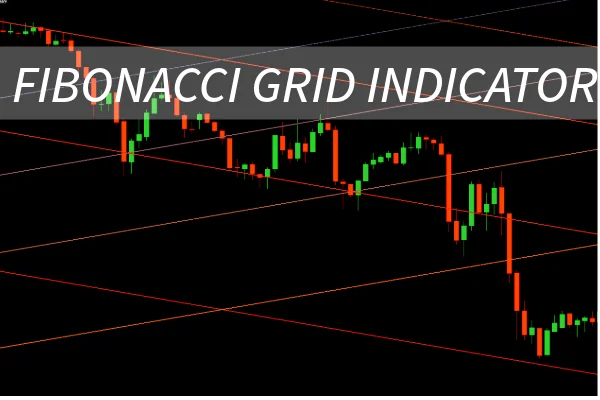
The Fibonacci Grid Indicator for MT4 by LuxAlgo is an advanced charting tool that automatically overlays Fibonacci-based channel grids across any market. Designed for traders who use price action, trend continuation, or reversal strategies, this indicator provides a structured visual map of support and resistance levels.
By dividing historical price ranges through Fibonacci ratios, it projects grid lines that help traders identify trend bias, potential reversal zones, and key trading areas across multiple timeframes.
This automation saves time and enhances precision—no more manual plotting of Fibonacci retracements or diagonal channels. Whether you trade Forex, indices, or cryptocurrencies, the Fibonacci Grid Indicator gives you a clearer sense of market structure and trend strength.
At its core, the Fibonacci Grid Indicator MT4 uses Fibonacci ratios (such as 0.382, 0.618, and 1.618) to divide a defined price range into equal, scalable zones. These ratios are mathematically derived from the Fibonacci sequence—a key concept used in technical analysis for decades.
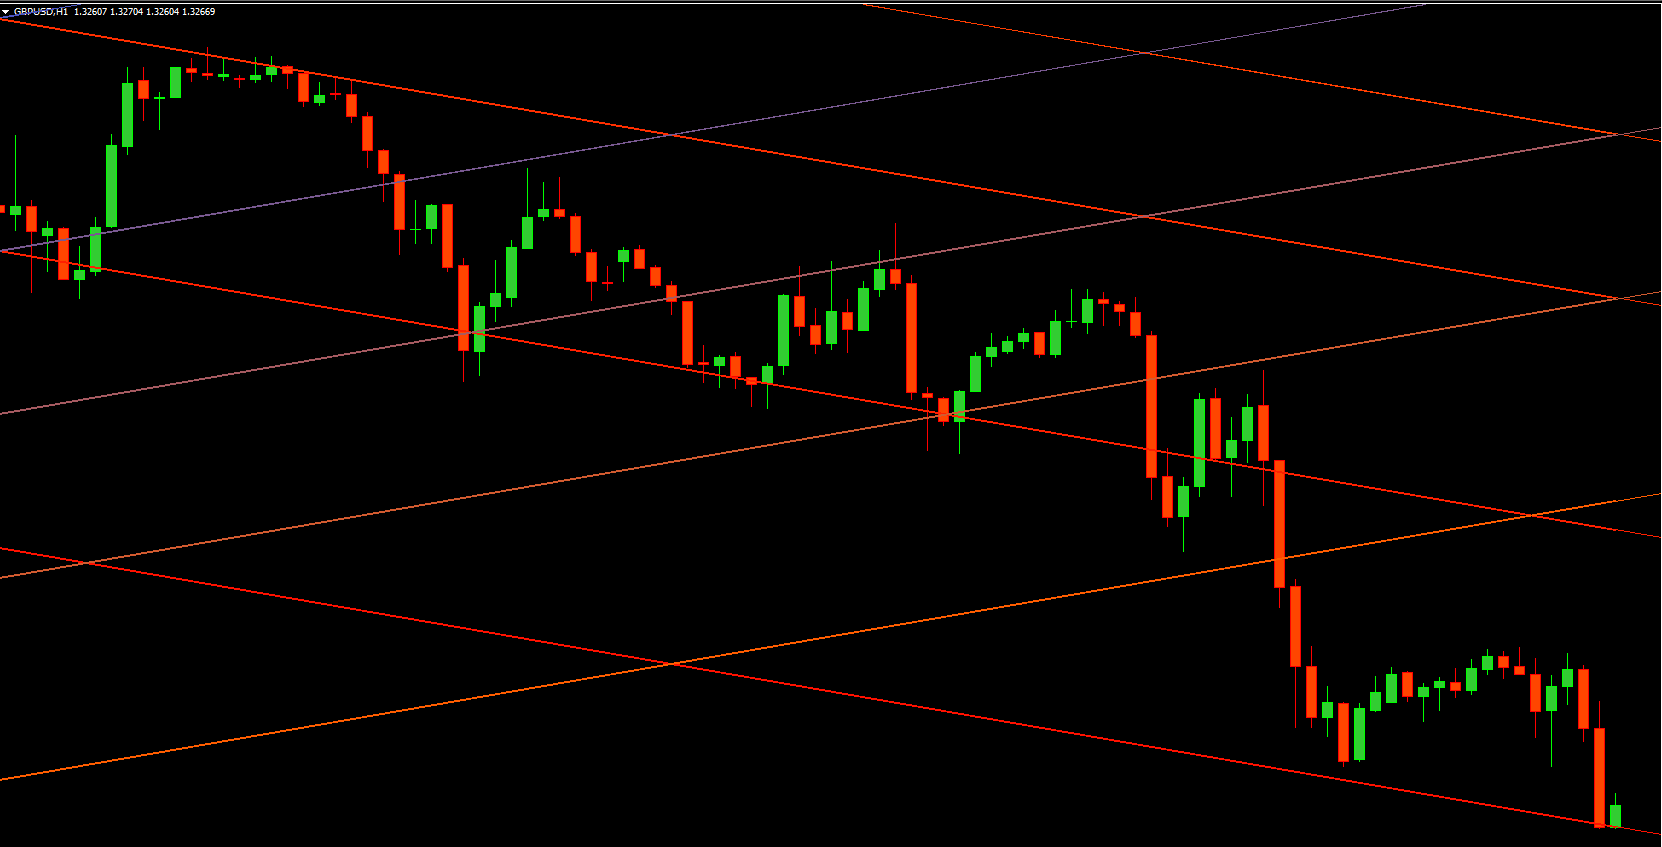
Once applied, the indicator overlays dynamic diagonal channels that expand and contract with market movement. These grids are plotted automatically, so traders can instantly view the current trend channel, potential reversal zones, and price projection targets.
This structured approach helps traders make more confident decisions in both trending and consolidating markets. When price consistently respects certain grid levels, it confirms a strong directional trend. Conversely, repeated rejections or consolidations near grid intersections may indicate trend exhaustion or breakout potential.
Unlike traditional indicators that provide buy or sell arrows, the Fibonacci Grid Indicator delivers visual trading signals. Each grid line acts as a potential reaction zone—where price may reverse, consolidate, or break out.
Upper and Lower Grid Lines: When price repeatedly respects these levels, it signals a strong directional trend or channel.
Mid-Level Zones: Often act as equilibrium points or areas for potential pullbacks.
Breakouts: When price moves decisively beyond the grid boundaries, it suggests momentum acceleration or trend reversal.
Traders can combine these signals with candlestick patterns, moving averages, or momentum oscillators to refine entry and exit points. The indicator’s structured framework adds precision to discretionary trading decisions.
To maximize results with the Fibonacci Grid Indicator MT4, consider the following best practices:
Combine with Trend Tools: Use moving averages or ADX to confirm trend direction.
Watch for Confluence: Pay attention when Fibonacci grid levels align with historical support or resistance.
Adjust Timeframes: Use higher timeframes (H4, D1) for broader trend context and lower timeframes (M15, M30) for fine-tuned entries.
Avoid Overcrowding Charts: Use clear grid spacing to maintain readability.
By following these steps, traders can transform complex price data into actionable insights with the Fibonacci Grid Indicator.
The Fibonacci Grid Indicator by LuxAlgo stands out for its precision, automation, and adaptability. It provides traders with:
Automatic channel plotting based on Fibonacci mathematics.
Multi-timeframe compatibility for flexible market analysis.
Clean, non-repainting visualization for reliable technical assessment.
Enhanced clarity for trend and reversal identification.
This indicator is especially valuable for technical traders who rely on price structure and market geometry to forecast future movements.
The Fibonacci Grid Indicator for MT4 by LuxAlgo is a visually powerful forecasting tool that blends Fibonacci mathematics with dynamic grid structures. It simplifies the identification of support, resistance, trend channels, and reversal zones—all in one intuitive display.
Whether you’re a short-term scalper or long-term swing trader, this indicator adds analytical depth and clarity to your trading decisions.
👉 Discover more professional Forex tools like this at IndicatorForest.com and elevate your trading strategy today.
Published:
Oct 10, 2025 07:15 AM
Category: