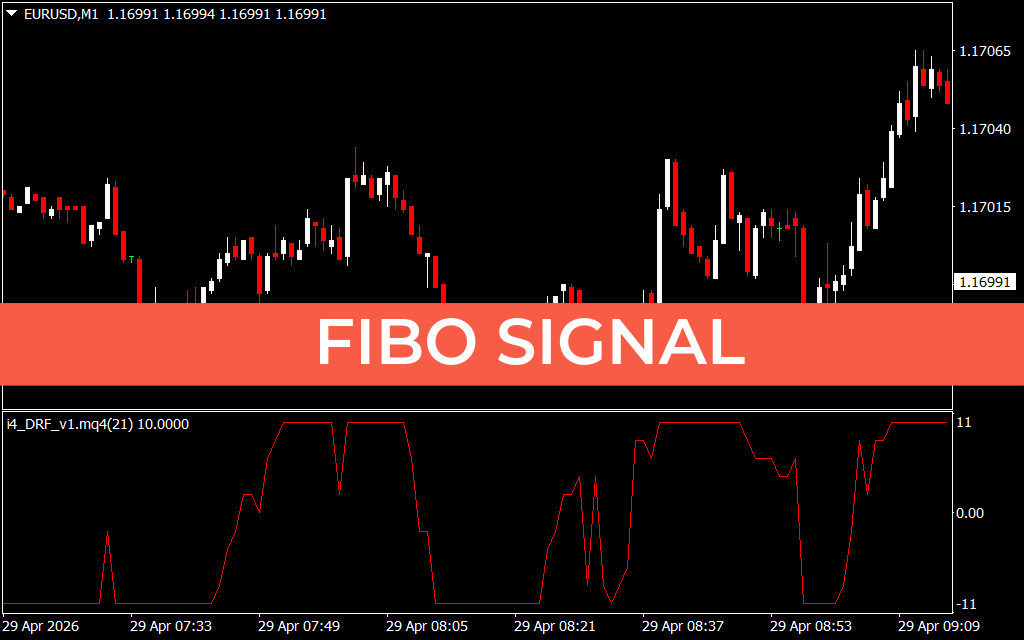
Unlocking Market Precision with the Fibo Signal Indicator
In the realm of technical analysis, few concepts carry as much weight as the Fibonacci sequence. Named after the Italian mathematician, these ratios appear everywhere in nature and, remarkably, within financial Price Action. The Fibo Signal indicator is a sophisticated trading tool that harnesses these mathematical proportions to identify high-probability entry and exit points, transforming complex retracement theory into actionable visual cues.
The Science Behind Fibonacci in Trading
Fibonacci trading is based on the idea that after a significant price movement, markets tend to "retrace" or pull back to specific levels before continuing in the original direction. The most critical ratios—23.6%, 38.2%, 61.8%, and 78.6%—act as invisible psychological zones where Supply And Demand often find equilibrium.
The Fibo Signal indicator automates this entire process. Instead of manually drawing grids and guessing which swing high or low is relevant, the indicator dynamically identifies structural pivots and plots the "Golden Ratio" zones directly on your chart.
Key Features of the Fibo Signal Indicator
This indicator is designed for traders who value speed and accuracy. Its primary functions include:
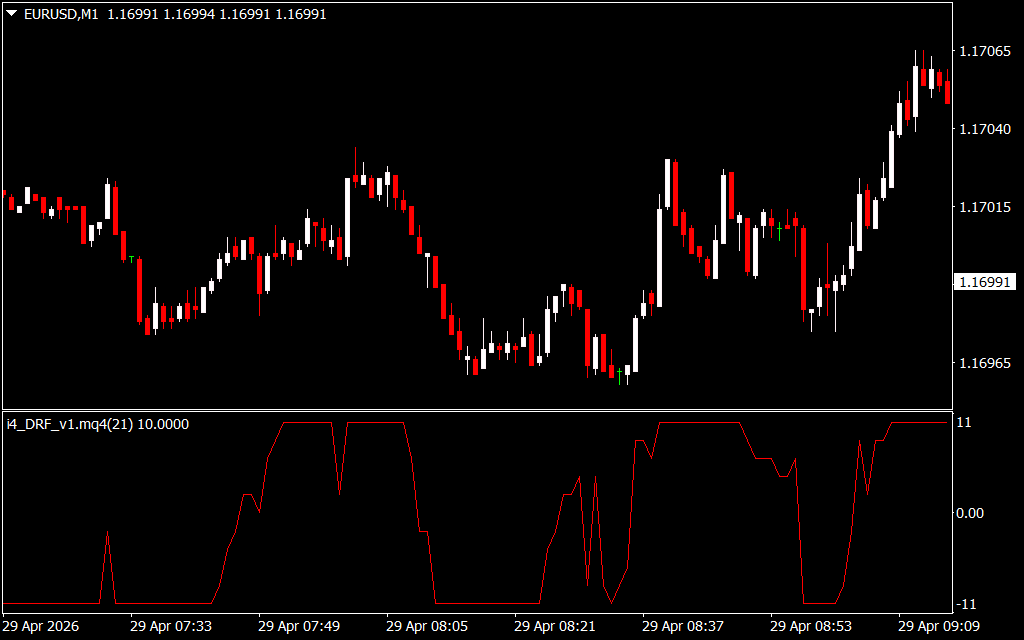
- Automatic Pivot Detection: The indicator constantly scans for the most recent significant price swings, ensuring your Fibonacci levels are always aligned with the current market structure.
- Trend Confirmation: It doesn't just show levels; it provides a directional bias. When price interacts with a key Fibo level and produces a reversal signal, the indicator highlights the opportunity.
- Scalp and Swing Versatility: Whether you are monitoring the M1 chart for quick "pips" or using the H4 for long-term positions, the Fibo Signal adapts its sensitivity to suit your timeframe.
Strategic Application: Buying the Dip and Selling the Rip
The most powerful way to use the Fibo Signal is by identifying confluence.
- The Retracement Entry: In an uptrend, wait for the price to pull back to the 61.8% "Golden" level. If the Fibo Signal produces a bullish alert at this zone, it indicates that the correction is likely over and the trend is ready to resume.
- Take Profit Targets: The indicator often includes Fibonacci expansion levels (like 161.8%). These serve as objective targets, allowing you to exit your trades before the market reaches exhaustion.
- Risk Management: Fibo levels provide logical areas for stop-loss placement. Placing a stop just beyond the 78.6% level ensures that your trade is protected by a zone where the original trend would be considered invalidated.
Why Choose Fibo Signal Over Manual Tools?
Manual Fibonacci drawing is prone to human error and subjective bias. Two traders might pick different starting points, leading to different results. The Fibo Signal removes this subjectivity, providing a consistent, rule-based approach to the markets. For intraday traders, the time saved by automation is often the difference between catching a move and missing it.
Conclusion
The Fibo Signal indicator is an essential bridge between mathematical theory and practical trading. By identifying the hidden levels where institutional buyers and sellers congregate, it gives you a professional edge in any market environment. Integrate this tool into your strategy today to start trading with the precision of the Golden Ratio.
1 Download
Last Update:
Apr 29, 2026 13:52 PM
Published:
Jan 31, 2026 02:18 AM
Category: