The DTOSC Indicator MT4—also known as the Dynamic Trader Oscillator—is a powerful blend of the RSI and Stochastic indicators. By combining these momentum tools into one oscillator, the DTOSC helps forex traders identify overbought, oversold, and Trend Reversal conditions with precision. Because it provides clear crossover signals, traders can apply simple yet effective entry and exit strategies in any market condition.
Designed to detect extreme price levels and momentum shifts, the DTOSC indicator is valuable for both beginner and advanced traders. It works across all chart timeframes, including daily, weekly, and monthly charts, making it suitable for multi-timeframe (MTF) analysis on MT4.
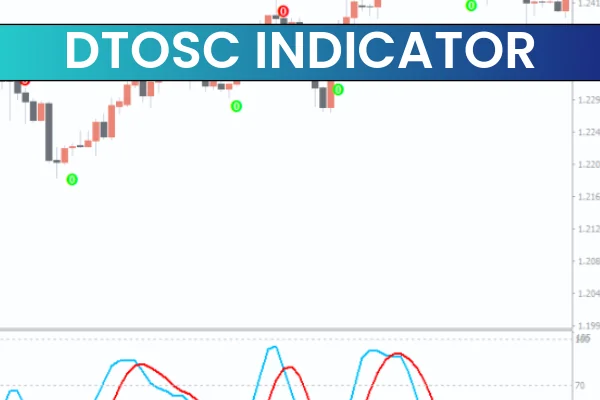
How the DTOSC Indicator MT4 Works
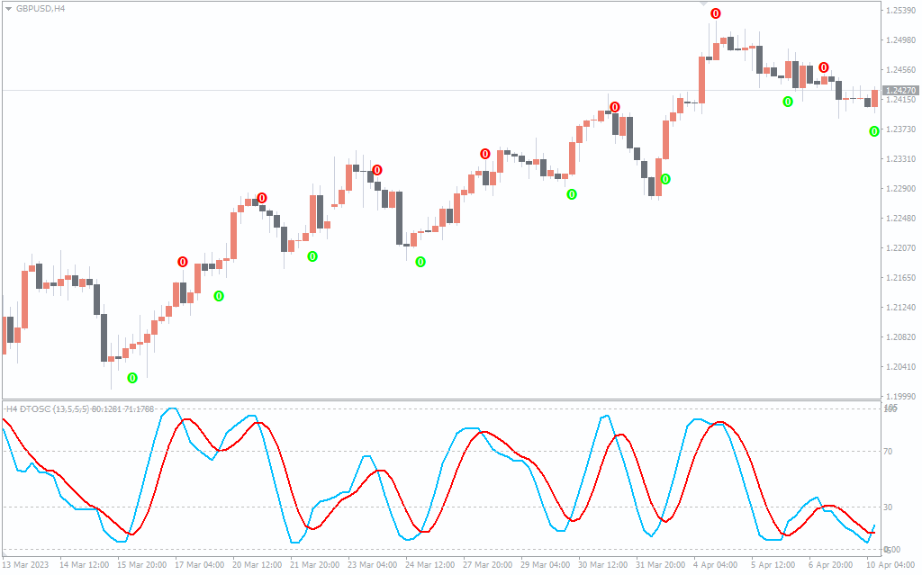
The DTOSC indicator displays two dynamic lines—commonly a blue line and a red line—within a dedicated indicator window. These lines represent the smoothed momentum derived from RSI and Stochastic calculations. When the lines cross, they signal a shift in trend direction or a potential reversal.
Because the oscillator reacts to price extremes, it helps traders determine:
Overbought zones (potential turning points downward)
Oversold zones (potential turning points upward)
Trend Continuation or exhaustion
Momentum strength and direction
This makes the DTOSC an ideal tool for swing trading, trend-following strategies, and reversal entries.
Trading Signals Using the DTOSC Indicator
Buy Signal – Bullish Crossover
When the blue line crosses above the red line, momentum shifts upward. This crossover typically occurs near oversold conditions or early in a new bullish trend.
Entry rules:
Enter a BUY trade immediately after the bullish crossover.
Place a stop loss below the previous swing low to reduce risk.
Target profits using the next opposite crossover or a defined risk–reward ratio.
This signal is particularly strong on H4, Daily, and Weekly timeframes.
Sell Signal – Bearish Crossover
A downward cross of the blue line below the red line signals weakening momentum and the start of a bearish movement.
Entry rules:
Enter a SELL trade once the bearish crossover forms.
Place a stop loss above the previous swing high.
Exit when the blue line crosses upward again or based on risk–reward settings.
This setup captures early trend reversals and supports long-term swing trading.
Best Timeframes for DTOSC Indicator MT4
While the DTOSC functions on all chart periods, it produces the most reliable signals on higher timeframes, such as:
H4
Daily
Weekly
Lower timeframes can cause noise and false signals, so traders often combine the indicator with trend analysis, support/resistance levels, or Price Action confirmation.
Why Forex Traders Prefer the DTOSC Indicator
The DTOSC Indicator MT4 is popular because it offers:
Faster trend detection than standard oscillators
Accurate overbought/oversold readings
Clear visual crossover signals
Reliable momentum tracking
Applicability to all currency pairs and timeframes
A simple learning curve suitable for beginners
Its ability to function as both a trend-following and reversal-detection tool makes it an excellent addition to any MT4 trading system.
Conclusion
The DTOSC Indicator for MT4 is a versatile and reliable oscillator for identifying trend cycles, momentum shifts, and reversal points using RSI and Stochastic logic. Although it works on all timeframes, it performs best on higher periods, where signals are more stable and accurate. Forex traders who want clear entry points with minimal complexity will find the DTOSC a valuable addition to their trading routine.
Explore more powerful MT4/MT5 tools and download the DTOSC indicator at IndicatorForest.com.
FAQ
9 Downloads
Published:
Nov 25, 2025 09:18 AM
Category: