Master Precision Breakouts with the Demarker Trendline Indicator
In the complex landscape of Forex trading, identifying the exact moment a trend shifts from a consolidation phase to an explosive breakout is the hallmark of a professional strategy. The Demarker Trendline Indicator for MetaTrader is a premier technical tool designed to automate one of the most effective methods in Price Action analysis: Tom DeMark’s sequential trendline logic. By combining objective trendline construction with real-time target projection, this indicator provides traders with a mathematical edge in catching high-velocity market moves.
Download Demarker Trendline for free. Automate Tom DeMark’s breakout logic with precise trendlines, target projections, and real-time price signals.
The Science of DeMark Trendlines
Traditional trendlines are often subjective, leading to inconsistent results. The DeMark method eliminates this ambiguity by using specific "TD points" (qualified highs and lows) to anchor the lines. The Demarker Trendline Indicator automates this process, drawing precise Support And Resistance lines based on recent price structural extremes.
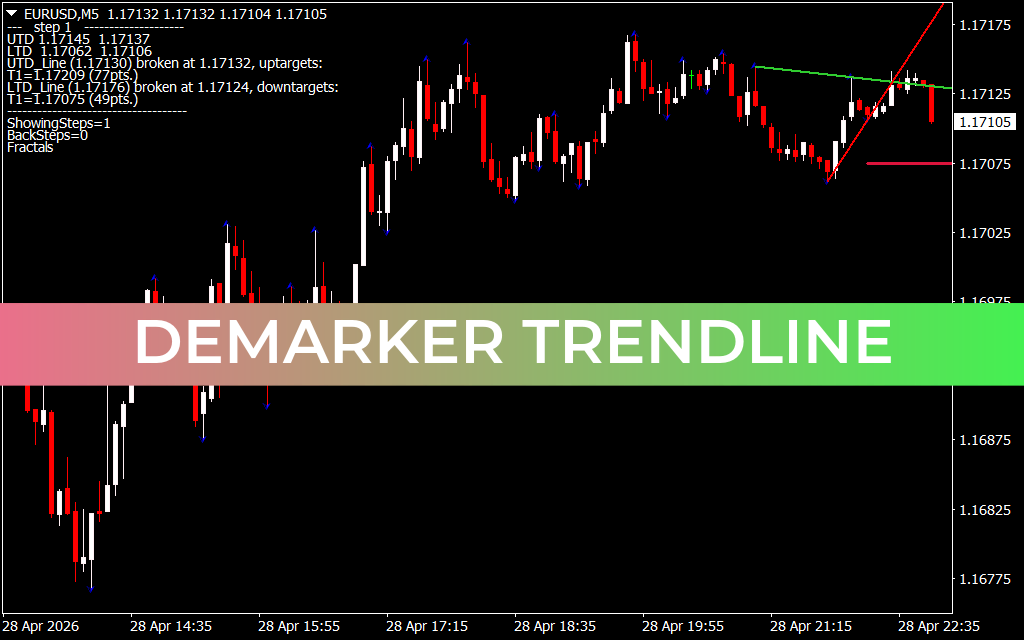
As shown in the EUR/USD M5 chart, the indicator provides a comprehensive roadmap:
- Qualified Resistance (Green Line): Formed by connecting specific peaks, this line represents the "ceiling" that buyers must break to initiate a bullish expansion.
- Qualified Support (Red Line): Formed by connecting specific troughs, this represents the "floor." A breach here indicates that bearish momentum has taken control.
- Target Projections (T1 Levels): Unique to this indicator is its ability to calculate price targets immediately upon a breakout. These levels, such as the 1.17209 uptarget seen in the example, are derived from the vertical distance of the price structure, giving traders clear exit points.
Strategic Advantages: Timing and Confluence
The primary strength of the Demarker Trendline is its focus on Breakout Validation. Many traders fall victim to "fakeouts"—where price briefly breaches a line only to reverse. This indicator helps filter these by identifying the strength of the breakout relative to the TD points.
For intraday traders and scalpers, the M5 and M15 timeframes offer a wealth of opportunities. When a candle closes firmly above a green TD resistance line, it signals a high-probability entry. Traders can then use the automated targets to manage their risk-to-reward ratios effectively. Furthermore, the indicator displays "Fractals" (blue and gray arrows), which serve as secondary confirmation points for price exhaustion and reversal.
A Professional Edge for Every Trader
Whether you are trading major pairs like EUR/USD or volatile commodities, the Demarker Trendline Indicator transforms a cluttered chart into an organized field of actionable data. It provides the structural clarity required to identify "springboards"—zones where price has been compressed and is ready for a significant directional shift.
By integrating this professional-grade tool into your MetaTrader arsenal, you replace subjective guesswork with mechanical precision. The indicator not only shows you where the market has been but, more importantly, projects where it is mathematically likely to go next. Stop chasing the market and start anticipating breakouts with the expert accuracy of the Demarker Trendline.
6 Downloads
Last Update:
Apr 29, 2026 02:00 AM
Published:
Jan 31, 2026 15:57 PM
Category: