Precision Market Timing with the CCI Haos Visual Indicator for MT4
In the high-stakes world of Forex trading, identifying the exact moment a trend exhausts itself is the key to capturing maximum profit. Most oscillators provide a general sense of momentum, but they often lack the visual clarity needed for rapid execution. The CCI Haos Visual indicator is a premier technical tool designed to solve this by blending Commodity Channel Index (CCI) logic with advanced visual smoothing, providing traders with a high-definition view of overbought and oversold conditions.
What is the CCI Haos Visual Indicator?
The CCI Haos Visual is an advanced momentum oscillator for MetaTrader 4 that acts as a comprehensive "market thermometer." It measures the current price's relationship to its statistical average, but with a unique visual twist. Unlike the standard single-line CCI, the Haos Visual version utilizes a multi-layered approach, often incorporating two or more signal lines that change color based on momentum intensity.
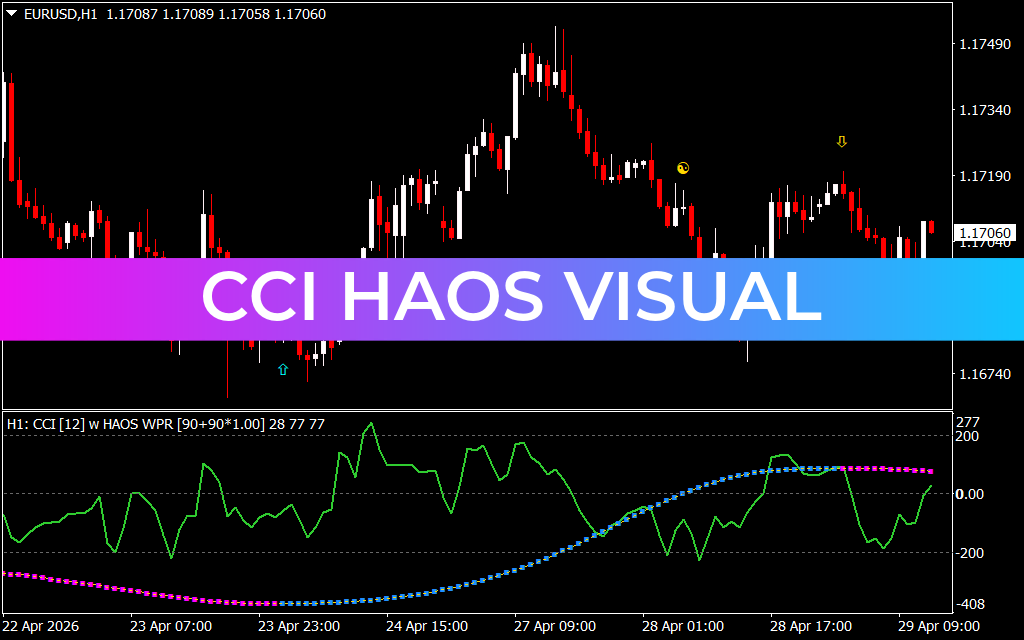
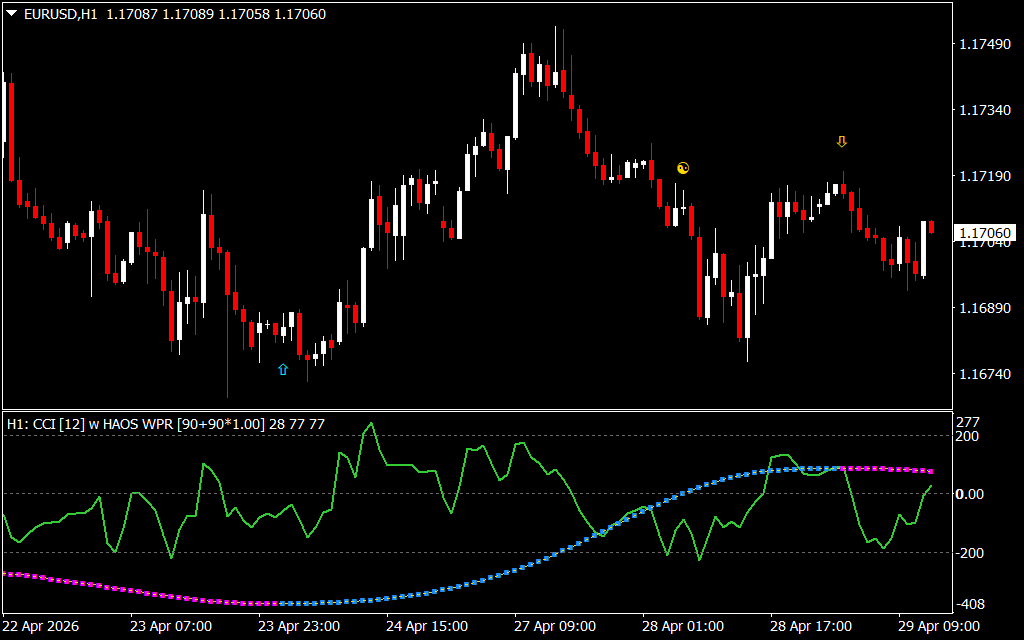
As seen on the H1 timeframe, the indicator features a dynamic sub-window where a fast-moving green line tracks immediate price swings, while a thicker, dual-colored signal line (transitioning between cyan/blue and magenta/pink) provides the broader trend context. This "visual" element allows traders to spot trend shifts the instant they occur.
Key Features of the Visual System
- Dual Momentum Analysis: By combining a fast CCI with a smoothed signal line, the indicator helps traders distinguish between a minor retracement and a full Trend Reversal.
- Extreme Level Tracking: The sub-window includes fixed horizontal levels (such as +200, +100, -100, and -200). When the indicator enters these extreme zones, it warns of an impending price correction.
- Color-Coded Trend Alignment: The primary signal line changes color to represent the "Path of Least Resistance." When the line is cyan, the bias is bullish; when it turns magenta, the bias shifts to bearish.
- Confluence Markers: Some versions include on-chart icons (like the yin-yang or arrow symbols) that appear when momentum reaches a mathematical confluence, serving as high-probability trigger points.
Strategic Trading Applications
The CCI Haos Visual is a powerhouse for both counter-trend traders and trend followers:
- Overbought/Oversold Reversals: A classic trade setup occurs when the green momentum line reaches the +200 level and starts to curl downward while the main signal line turns magenta. This indicates a high-probability "Short" entry.
- Trend Continuation: During a strong uptrend, look for the fast line to dip toward the zero line and then bounce upward, maintaining its green color. This represents a "buy the dip" opportunity within an established move.
- Divergence Detection: If price makes a new high but the CCI Haos Visual peaks lower than its previous high, you have discovered a hidden bearish divergence—a leading signal that the trend is losing steam.
Conclusion
The CCI Haos Visual indicator is an essential asset for any trader who values clarity and precision. By transforming complex momentum data into an intuitive, color-coded system, it removes the guesswork from trend analysis. Whether you are Scalping the M1 or swing trading the H1, the CCI Haos Visual provides the structural confidence needed to master market timing and trade with the flow of professional capital.
8 Downloads
Last Update:
Apr 29, 2026 16:03 PM
Published:
Jan 30, 2026 22:31 PM
Category: