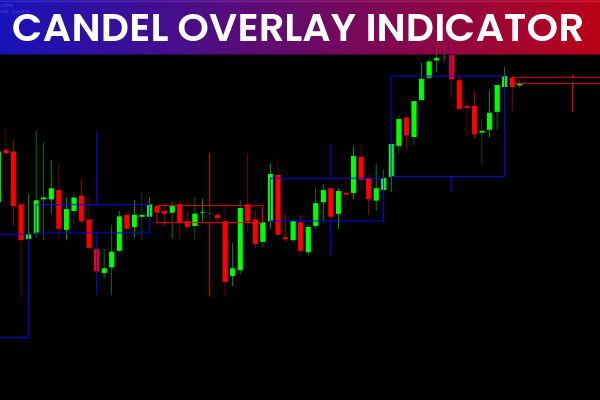
The Candle Overlay Indicator is a powerful MT4 tool designed to help traders perform multi-timeframe analysis efficiently. By displaying candlesticks from higher timeframes directly on lower timeframe charts, it eliminates the need to constantly switch between charts during analysis.
This indicator is ideal for scalping, day trading, and swing trading, offering valuable insight into the behavior of price across timeframes. Both beginner and experienced traders can benefit from observing how higher timeframe candlesticks influence Price Action in lower timeframes.
What is the Candle Overlay Indicator?
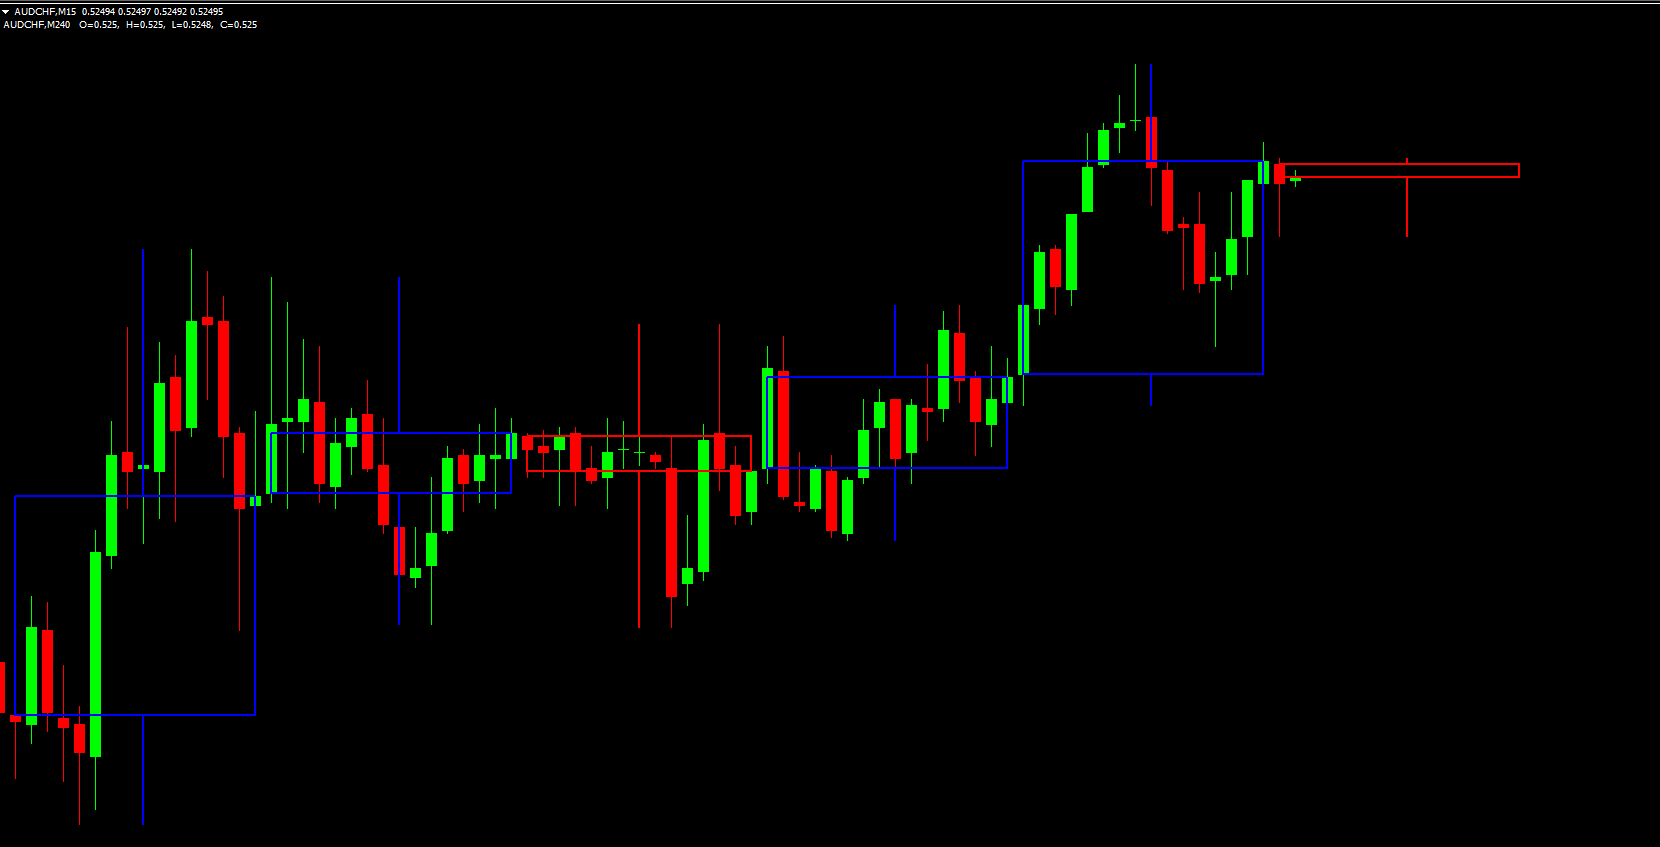
The Candle Overlay Indicator overlays candlesticks from a higher timeframe, such as H4, onto a lower timeframe chart, like H1. Traders can then observe:
Opening and closing prices of higher timeframe candles
Wick lengths and patterns
Bullish or bearish tendencies at higher timeframes
The indicator paints blue candlesticks for bullish price action and red candlesticks for bearish price action, making it visually intuitive.
Benefits of Using the Candle Overlay Indicator
Top-Down Analysis
Traders can make decisions using the context of higher timeframe candlesticks while actively trading on lower timeframes.
This approach improves the accuracy of entries and exits by accounting for higher timeframe momentum and reversals.
Enhanced Scalping and Day Trading
Scalpers can monitor higher timeframe price action for trend confirmation while executing trades on smaller timeframes.
Day traders can anticipate key turning points without switching charts, saving time and reducing errors.
Swing Trading Support
Swing traders can identify higher timeframe Support And Resistance levels, helping them hold positions longer with confidence.
Simplified Multi-Timeframe Analysis
The indicator reduces the need for constantly monitoring multiple charts, making it easier to track market behavior and trends across timeframes.
How to Use the Candle Overlay Indicator
Select a Lower Timeframe Chart
Attach the Candle Overlay Indicator to your chosen lower timeframe, such as M15 or H1.
Choose a Higher Timeframe to Overlay
The indicator works best with H4 and below. D1 and higher are not supported, which aligns with typical intraday trading needs.
Observe Candle Colors
Blue candlesticks: Bullish higher timeframe candles
Red candlesticks: Bearish higher timeframe candles
Analyze Market Behavior
Use the higher timeframe candlesticks as reference for key support/resistance and trend confirmation.
Integrate with your trading strategy to anticipate potential bounces or breakouts.
Trade Decision Making
The Candle Overlay Indicator does not generate trade signals. It should be used in combination with other indicators or trading systems for optimal decision-making.
Who Should Use the Candle Overlay Indicator?
Scalpers: Gain insight into higher timeframe trends while executing fast trades on lower timeframes.
Day Traders: Identify key turning points and monitor multiple timeframes without switching charts.
Swing Traders: Determine potential support/resistance areas and trend direction to hold trades longer.
New Traders: Learn to analyze multiple timeframes effectively and understand market structure.
Professional Traders: Enhance technical analysis and strategy development with multi-timeframe context.
Conclusion
The Candle Overlay Indicator for MT4 simplifies multi-timeframe forex analysis by overlaying higher timeframe candlesticks on lower timeframe charts. It provides visual clarity for price action, supports scalping, day, and swing trading, and assists traders in making better-informed trading decisions.
Download the Candle Overlay Indicator for free from IndicatorForest.com and take your multi-timeframe analysis to the next level.
FAQ
8 Downloads
Published:
Nov 27, 2025 02:50 AM
Category: