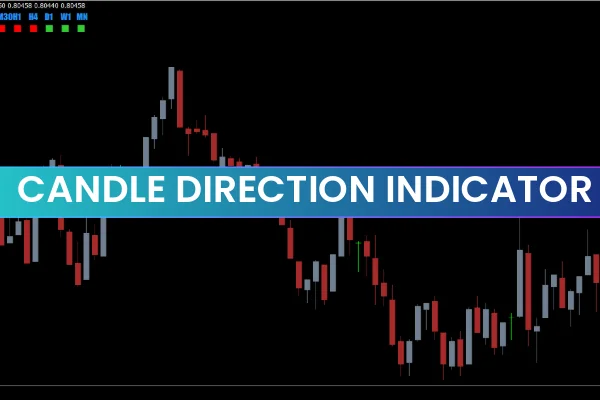
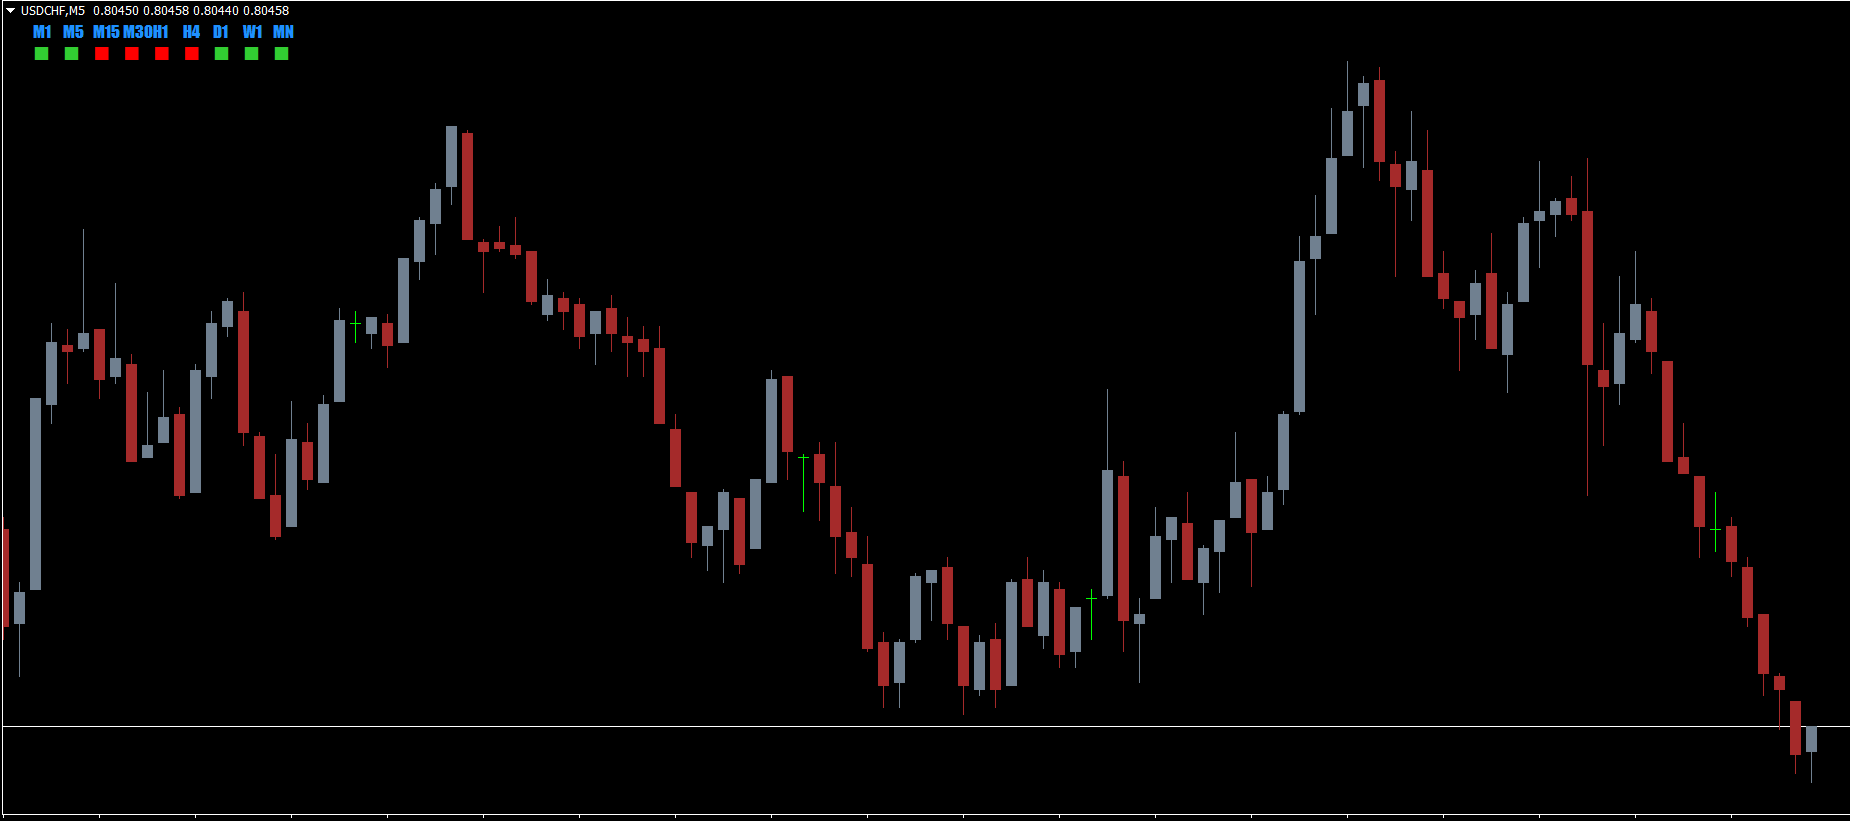
The Candle Direction Indicator MT4 scans candlesticks from all available chart periods—ranging from M1 to MN (Monthly)—and displays them in a color-coded table at the bottom of the chart.
Each timeframe candle is represented by a colored box:
Green = Bullish candle (price closing higher)
Red = Bearish candle (price closing lower)
White = Neutral candle (no clear direction)
This easy-to-read visual layout allows traders to quickly confirm whether most timeframes align in the same direction, indicating a strong trend.
How the Candle Direction Indicator Works
The indicator automatically pulls data from multiple chart timeframes and updates the display in real time. For example, if you’re trading on the H1 chart, it will also check the status of M5, M15, M30, H4, D1, W1, and MN candles simultaneously.
By analyzing multiple timeframes at once, traders can confirm the dominant market bias:
If most candles are green, the trend is bullish—consider buy positions.
If most candles are red, the trend is bearish—consider sell positions.
If candles are mixed or mostly white, it signals market indecision or consolidation.
This approach gives traders a top-down market view without manually switching between charts, saving time and reducing errors.
Candle Direction Indicator Trade Setup Example
In the GBPUSD H1 chart example, the indicator displays the color boxes below the main price chart, each labeled with a corresponding timeframe.
Suppose:
M5, M15, M30, and H1 candles are green
H4 and D1 are also green
W1 shows a neutral (white) reading
This suggests strong bullish momentum, supported across short and medium-term timeframes. Traders can enter a buy trade with a stop loss below the previous swing low to manage risk effectively.
Likewise, if most boxes turn red, indicating bearish sentiment, traders can open sell positions with a stop loss above the recent swing high.
By combining these signals with other MT4 tools like support/resistance or moving averages, traders can create powerful trend confirmation setups.
Key Features of Candle Direction Indicator
Multi-Timeframe Analysis: Checks candle direction across all timeframes (M1–MN).
Color-Coded Display: Green, red, and white boxes for instant trend clarity.
Real-Time Updates: Reflects live changes in candle structure.
Trend Confirmation Tool: Ideal for verifying momentum strength.
Beginner-Friendly Interface: Works out-of-the-box with zero complex settings.
Universal Compatibility: Functions with all Forex pairs and assets on MT4.
How to Install the Candle Direction Indicator on MT4
Download the Candle Direction Indicator from IndicatorForest.com.
Open your MetaTrader 4 platform.
Go to File → Open Data Folder → MQL4 → Indicators.
Paste the downloaded file into the folder.
Restart MT4, then attach the indicator to any chart.
The color-coded candle direction table will appear below your chart automatically.
Conclusion
The Candle Direction Indicator for MT4 is a must-have for traders using multi-timeframe analysis. It simplifies trend detection by visually summarizing candle directions across all periods, helping traders stay aligned with the overall market flow.
This tool is perfect for both new and professional Forex traders who value simplicity and accuracy in technical analysis.
👉 Download the Candle Direction Indicator free from IndicatorForest.com and start trading with a clear multi-timeframe perspective today!
FAQ
4 Downloads
Published:
Nov 10, 2025 13:19 PM
Category: