Mastering Mean Reversion with the Bollinger Bands Rebound Strategy
In the fast-paced trading environment of 2026, volatility is both a challenge and an opportunity. For traders looking to capitalize on market "elasticity," the Bollinger Bands Rebound strategy remains one of the most reliable methods for identifying high-probability reversal points. By combining statistical standard deviation with Price Action, this strategy helps traders pinpoint exactly when a market is overextended and ready to snap back to its mean.
The Anatomy of Bollinger Bands
Developed by John Bollinger, this indicator consists of three distinct lines:
- The Middle Band: A 20-period simple moving average (SMA) that serves as the base.
- The Upper Band: Usually two standard deviations above the middle band.
- The Lower Band: Usually two standard deviations below the middle band.
The magic of the Bollinger Bands Rebound lies in the concept of volatility contraction and expansion. When price touches or pierces the outer bands, it is statistically considered "expensive" or "cheap" relative to its recent average.
Identifying the Rebound Setup
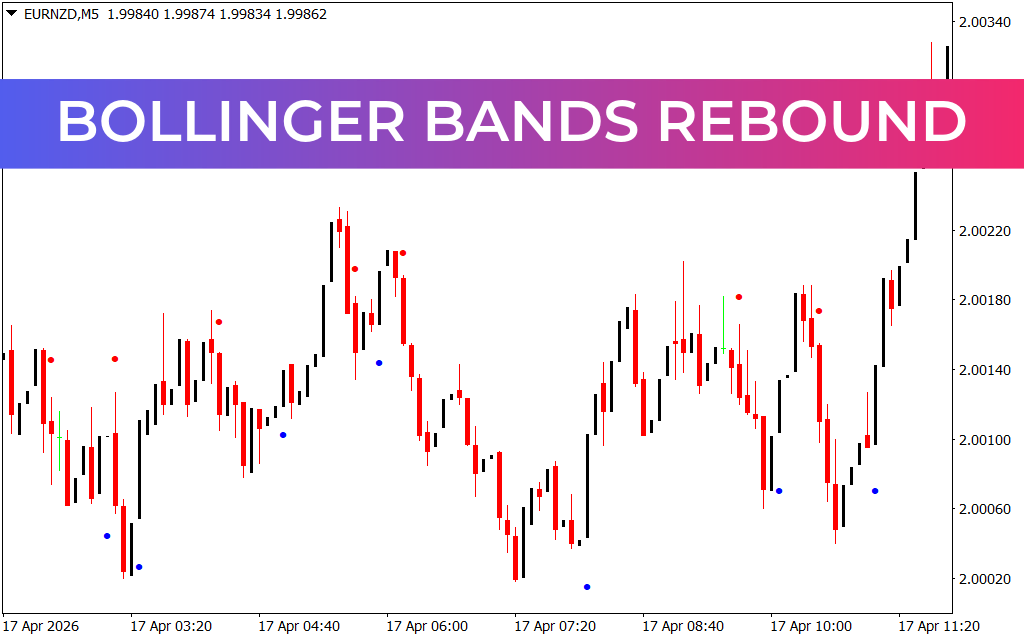
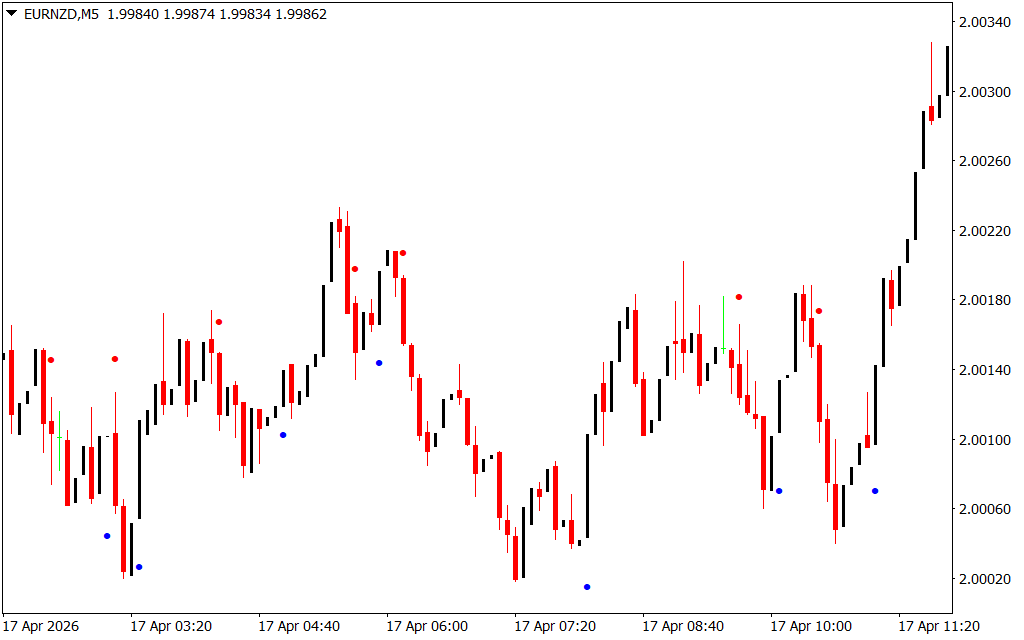
As demonstrated in the EURNZD 5-minute (M5) chart, a "Rebound" occurs when price action aggressively tests an outer band but fails to close beyond it, followed by a reversal candle. This signal indicates that the momentum driving the move has exhausted, and a return to the middle SMA is imminent.
- Bullish Rebound: Look for price to touch the lower band during a localized sell-off. If a bullish rejection candle (like a pin bar or engulfing pattern) forms, it signals an entry point with a target set at the middle band or the opposing upper band.
- Bearish Rebound: When price surges to the upper band, look for signs of distribution. A rejection of the upper band suggests that the buying pressure has dried up, offering a short-selling opportunity back toward the median.
Scaling for Day Trading and Scalping
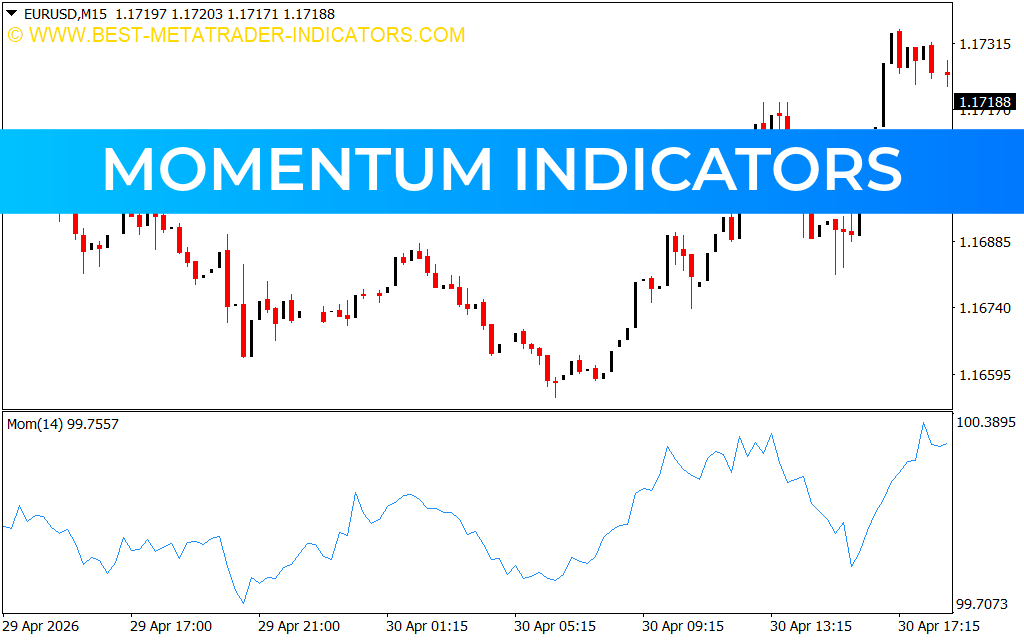
The Bollinger Bands Rebound is a favorite among scalpers using M5 and M15 timeframes. Because markets spend roughly 90% of their time within the bands, the rebound strategy provides frequent trading opportunities throughout the London and New York sessions. By filtering these signals with a secondary Momentum Indicator—like an RSI or MACD—traders can increase their win rate by ensuring they aren't "catching a falling knife" during a strong trending breakout.
Professional Visual Clarity
For modern traders, chart hygiene is essential. The Bollinger Bands Rebound setup is best viewed on a high-contrast dark screen, as seen in professional MT4/MT5 setups. This clarity allows the eye to instantly catch the "squeeze" (when bands tighten) and the subsequent "walk" (when price hugs a band) or "rebound."
Why Use the Bollinger Bands Rebound in 2026?
Institutional algorithms often hunt for liquidity at these statistical extremes. By using a dedicated Bollinger Bands Rebound indicator, retail traders can align themselves with these institutional flows. It transforms a simple technical tool into a comprehensive map of market psychology, helping you trade with logic, discipline, and a mathematical edge.
10 Downloads
Last Update:
Apr 19, 2026 21:59 PM
Published:
Feb 03, 2026 17:47 PM
Category: