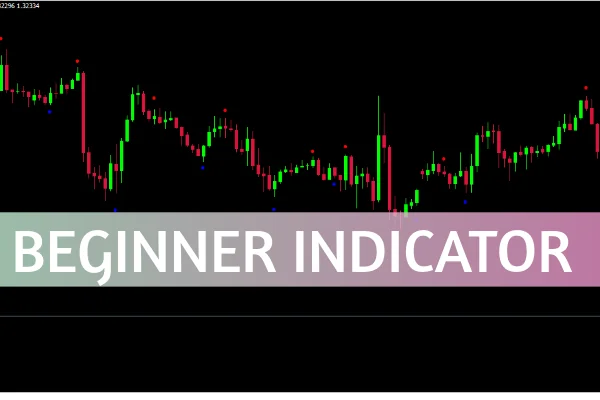
The Beginner Indicator for MetaTrader 4 is an easy-to-use trend-following tool designed for traders who want a simple yet effective way to read market structure. This indicator highlights key highs and lows on the price chart, providing visual zones that often act as support and resistance levels. By analyzing price peaks and troughs within a given range, it helps traders spot trend reversals and trend continuation opportunities with ease.
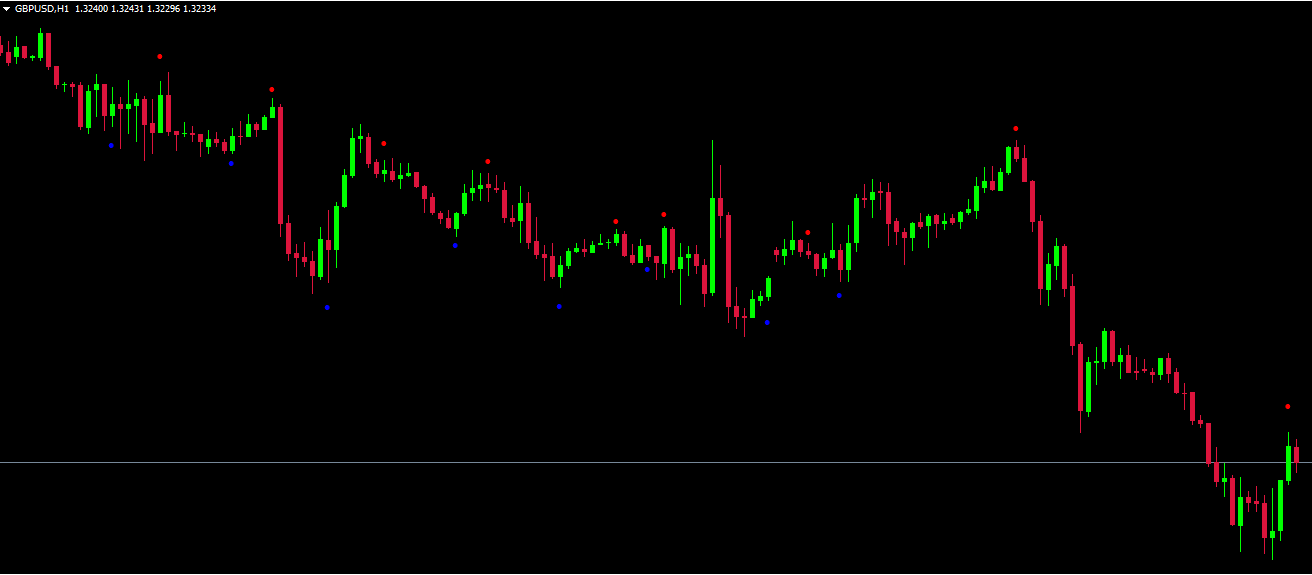
Unlike many complex indicators, the Beginner Indicator simplifies market analysis by displaying color-coded dots — red for highs (resistance zones) and blue for lows (support zones) — allowing even beginner traders to understand market momentum visually.
The Beginner Indicator MT4 examines the recent price movements and compares the extremes of the range to mark significant swing highs and lows. These levels often correspond to psychological market zones where traders make important decisions, such as entering or exiting positions.
Red Dots represent swing highs or resistance levels.
Blue Dots represent swing lows or support levels.
When the price approaches one of these dots, traders can anticipate potential reactions — a bounce (reversal) or a breakout (continuation).
This makes the indicator especially useful for traders following price action, support/resistance strategies, or breakout systems.
The blue and red dots drawn by the indicator serve as zones of interest. Traders should monitor these areas closely since they can act as turning points in the market. When the price nears a blue dot, it could signal a potential buying opportunity, while a red dot might indicate a potential selling opportunity.
A powerful method is to wait for the price to break through one of these levels and then retest it.
For example:
If the price breaks above a red dot (resistance) and later retests it, that level may turn into new support, offering a buy setup.
Conversely, if the price breaks below a blue dot (support) and retests it, it could signal a sell opportunity.
Since the Beginner Indicator can redraw dots as new price data forms, it’s best used alongside confirmation tools such as:
Moving Averages (MA)
Relative Strength Index (RSI)
Price Action Patterns (Candlestick Reversals)
This approach helps filter false signals and improves overall accuracy.
The default settings work well for most traders, but you can adjust the period or sensitivity based on your trading style.
Scalpers may prefer shorter timeframes (M5–M15).
Swing traders often find the indicator more reliable on H1–H4 charts.
Day traders can benefit from the M30 timeframe for balanced signals.
Remember, it’s essential to test the indicator on a demo account before applying it to live trades.
Simple visual representation of support and resistance
Ideal for identifying trend reversals and breakouts
Suitable for new traders learning market structure
Works on all currency pairs and timeframes
Can be combined with other technical tools for better accuracy
The Beginner Indicator for MetaTrader 4 is a practical and straightforward tool that helps traders identify market turning points and trend continuation zones effectively. While it shouldn’t be used in isolation due to its tendency to redraw, combining it with price action analysis or other indicators significantly enhances its reliability.
You can download the Beginner Indicator for free and start using it today to improve your trading confidence and strategy.
👉 Visit IndicatorForest.com to explore more free and premium MT4/MT5 indicators designed to simplify your trading journey.
Published:
Oct 29, 2025 12:54 PM
Category: