Anticipating Market Cycles with the Back Future Indicator
In the high-stakes environment of Forex trading, most indicators are designed to tell you where the market has been. These "lagging" indicators often result in late entries and missed opportunities. To gain a true edge, professional traders look for "leading" indicators that attempt to project future price movement based on historical cyclicality. The Back Future Indicator is a premier tool in this category, designed to identify recurring market patterns and forecast potential trend shifts before they manifest on the price chart.
The Science of Market Cyclicality
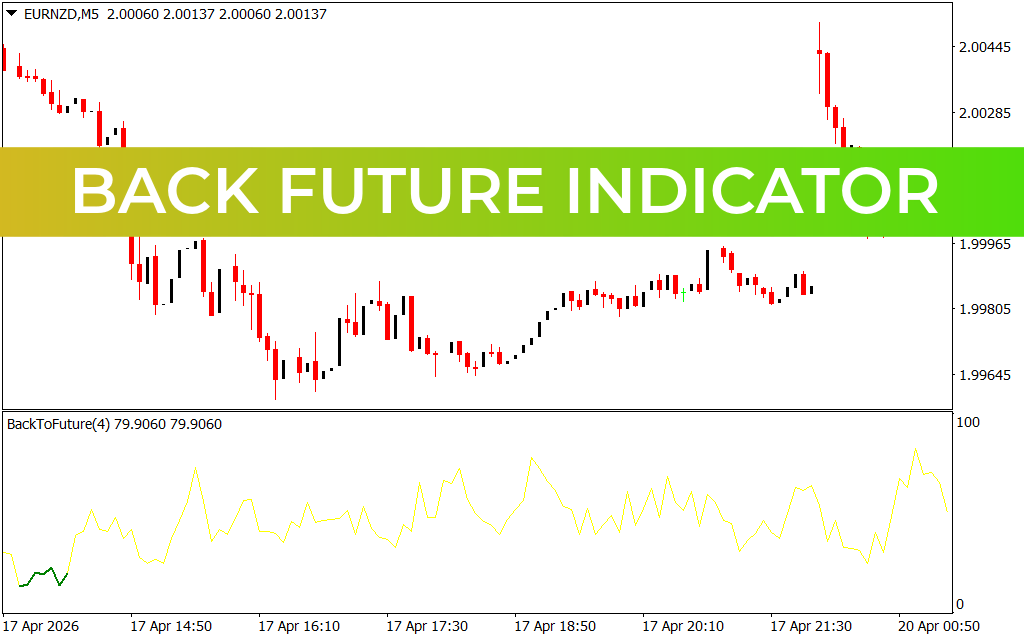
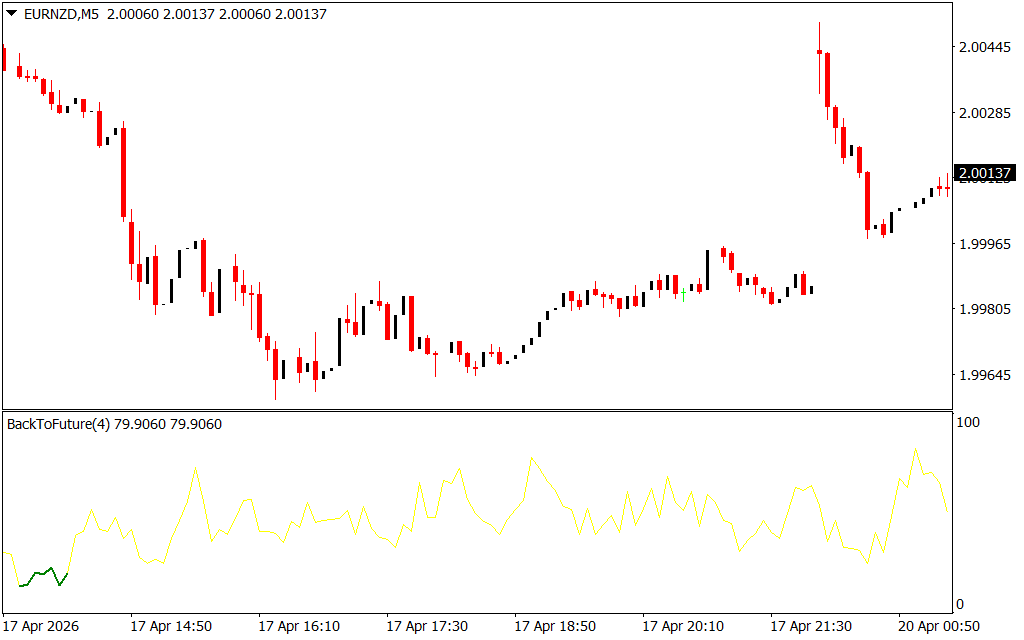
The core philosophy behind the Back Future Indicator is that markets move in repetitive waves driven by human psychology and institutional cycles. By analyzing past price structures, the algorithm identifies similar "DNA" in current Price Action to project the most likely path forward. As seen on the EURNZD M5 chart, the indicator operates in a dedicated sub-window, providing a streamlined visual representation of expected momentum.
The indicator is characterized by its dynamic, color-coded line:
- The Trend Ribbon: The line fluctuates between the 0 and 100 levels, much like a traditional oscillator, but with a predictive twist.
- Bullish Green Zones: When the indicator turns green at the beginning of a cycle, it suggests that a bullish expansion is likely.
- Momentum Yellow Line: The majority of the projection is displayed in yellow, representing the forecasted path of the trend. When this line hits extreme levels (near 100 or 0), it warns traders of upcoming exhaustion points.
Strategic Application: Trading the Projection
For day traders operating on fast-moving timeframes like the 5-minute (M5) chart, the Back Future Indicator acts as a powerful "early warning system." Instead of waiting for a Moving Average crossover that might happen after the move is halfway over, traders can use the indicator’s slope to anticipate the next leg.
- Cycle Bottoms: When the indicator bottoms out and begins to curve upward, traders look for long entries, anticipating a move toward the upper 100 level.
- Cycle Peaks: As the yellow line approaches the 100 mark, it indicates the trend is reaching a historical exhaustion point, signaling a prime time to scale out of positions or look for reversal setups.
- Trend Confirmation: The indicator is most effective when used in conjunction with price action. If the Back Future line is rising while price breaks above a local resistance level, the "confluence" provides a high-probability trade signal.
Why Choose a Predictive Approach?
The primary advantage of the Back Future Indicator is reduction in lag. By focusing on the "rhythm" of the market rather than just the mathematical average of past candles, it allows traders to be proactive rather than reactive. This is especially vital in pairs like EURNZD, where volatility can be high and trends can shift rapidly.
Integrating the Back Future Indicator into your MetaTrader setup provides a professional-grade dashboard for cycle analysis. It helps you visualize not just where the market is, but where it is "supposed" to be based on historical frequency. By mastering this temporal edge, you can navigate the global markets with the confidence of a trader who is always one step ahead of the curve.
3 Downloads
Last Update:
Apr 20, 2026 21:39 PM
Published:
Feb 03, 2026 16:45 PM
Category: