Master Market Momentum with the Awesome Indicator
In the high-speed world of Forex and CFD trading, understanding the "velocity" of price movement is just as important as knowing the direction. While many traders rely on lagging moving averages, professional technical analysts often turn to the Awesome Indicator (AO) to reveal the hidden energy behind market trends. Developed by the legendary Bill Williams, this tool is designed to provide a high-definition view of momentum, helping traders distinguish between a healthy trend and one that is rapidly losing steam.
The Mathematics of Momentum
The Awesome Indicator is a momentum oscillator that measures the market's current driving force. Unlike standard oscillators that use close prices, the AO is calculated by comparing a 5-period simple moving average (SMA) of the median prices ($\frac{High + Low}{2}$) to a 34-period SMA of the median prices. By subtracting the slower average from the faster one, the indicator identifies whether short-term momentum is accelerating or decelerating relative to the long-term trend.
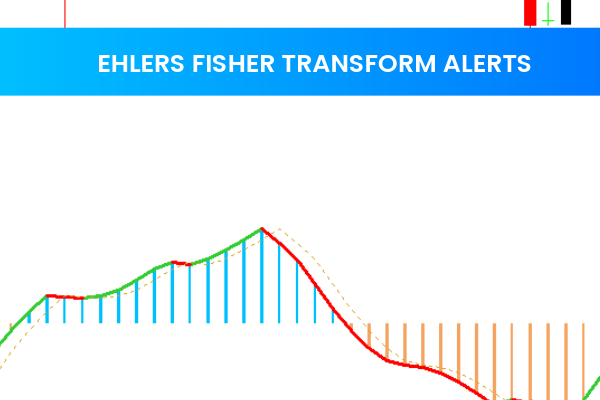
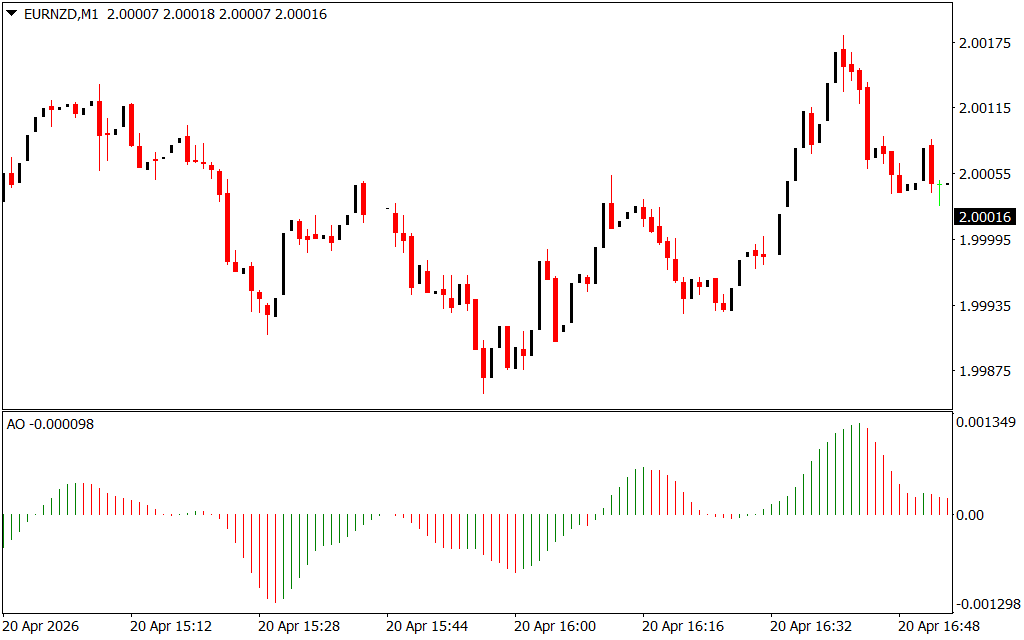
As shown on the EURNZD M1 chart, the Awesome Indicator provides a distinct vertical histogram centered around a zero-line:
- Green Bars: Indicate that momentum is higher than the previous bar. This signifies increasing bullish strength or weakening bearish pressure.
- Red Bars: Indicate that momentum is lower than the previous bar. This signifies increasing bearish strength or weakening bullish pressure.
- Zero-Line Crosses: These are critical trend-shift signals. When the histogram moves from negative to positive territory, it confirms a bullish breakout. A move from positive to negative territory confirms a bearish breakdown.
High-Probability Trading Strategies
The versatility of the Awesome Indicator makes it a staple for both scalpers and swing traders. On a fast-moving timeframe like the 1-minute (M1), it helps traders time their entries with surgical precision.
- The Saucer Signal: This setup identifies rapid momentum shifts within a trend. For a bullish saucer, you look for two consecutive red bars followed by a green bar above the zero line. This suggests that a minor pullback has ended and the main trend is resuming.
- Twin Peaks: This is a powerful divergence-based strategy. If the price makes a lower low but the AO histogram makes a higher low (while staying below the zero line), it indicates that the selling pressure is exhausted. This often precedes a major bullish reversal.
- The Zero-Line Crossover: For many automated systems, this is the definitive confirmation. A crossover acts as a "green light" to take trades in the direction of the new momentum, ensuring you are never caught trading against the prevailing market force.
Why Every MetaTrader Dashboard Needs the AO
The primary benefit of the Awesome Indicator is its ability to filter out "market noise." Because it uses median prices rather than just the closing price, it offers a more balanced view of the period's overall activity. In volatile pairs like EURNZD, this filtering is essential to avoid "whipsaws" during consolidation.
By integrating the Awesome Indicator into your technical setup, you move beyond basic trend following. You gain the ability to "see" the strength of the move before it is fully reflected in the Price Action. Whether used as a standalone signal generator or a trend filter, the AO provides the mathematical edge required to navigate modern financial markets with confidence and clarity.
1 Download
Last Update:
Apr 20, 2026 22:26 PM
Published:
Feb 03, 2026 13:47 PM
Category: