Master Multi-Asset Support and Resistance with the AY MML Dashboard V1.1
In the high-speed trading environment of 2026, technical analysis is moving beyond single-chart views toward holistic market oversight. The AY MML Dashboard V1.1 is a revolutionary MetaTrader indicator that brings the power of Murrey Math Lines (MML) to a comprehensive, multi-currency dashboard. Designed for professional traders who need to monitor Support And Resistance levels across various assets simultaneously, this tool eliminates the need for manual chart flipping and provides institutional-level clarity on market structure.
The Power of Murrey Math Theory
Murrey Math is a complex trading system based on the observation that Price Action often moves in geometric patterns and specific fractals. It divides price action into eight equal segments, known as 1/8th intervals. Each level has a specific psychological and mathematical significance:
- 8/8 and 0/8 Levels: These represent the "ultimate" resistance and support. Price rarely breaks these without a significant fundamental catalyst.
- 4/8 Level: The major pivot point. If price is above this, the market is considered bullish; below it, bearish.
- 1/8 and 7/8 Levels: Known as the "weak, stall, and reverse" points, these often signal the exhaustion of a trend.
Multi-Asset Efficiency in Real-Time
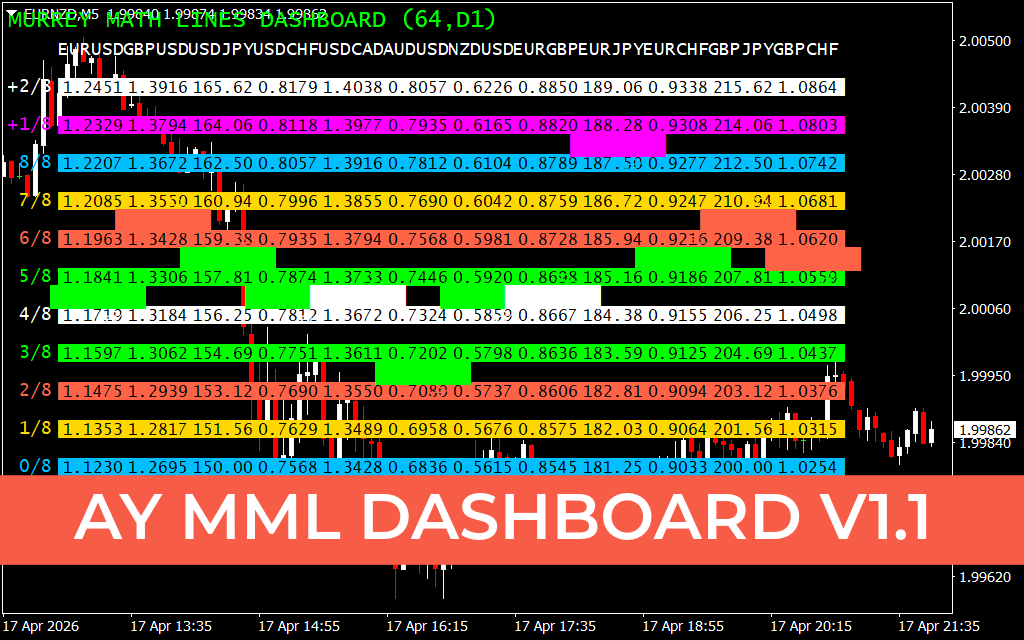
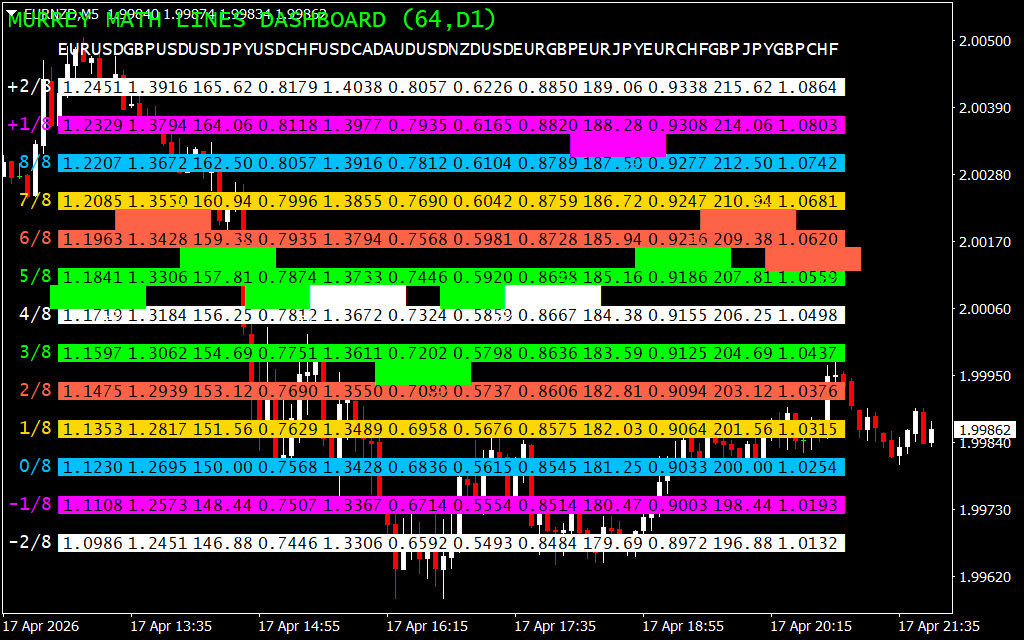
The AY MML Dashboard V1.1 stands out by aggregating this data into a single, high-contrast interface. As demonstrated in the EURNZD 5-minute (M5) chart, the dashboard monitors over a dozen major pairs—including EURUSD, GBPUSD, AUDUSD, and more—displaying their current position relative to their MML levels.
Instead of analyzing one pair at a time, you can see at a glance which assets are hitting "Ultimate Support" (0/8) or "Extreme Overshoot" (+2/8) levels. This allows you to cherry-pick the highest-probability reversal or breakout setups across the entire forex market in seconds.
Strategic Execution and Divergence
By utilizing the AY MML Dashboard, traders can identify Market Synchronization. For example, if the dashboard shows that multiple USD-related pairs are hitting their 8/8 resistance levels simultaneously, it provides high-confidence confluence for a broad USD reversal. This macro-level view is something traditional single-line indicators simply cannot provide.
Professional UI for the Modern Trader
Visual efficiency is critical for decision-making. The AY MML Dashboard V1.1 is optimized for professional dark mode setups, utilizing a vibrant color-coded system:
- Magenta and Blue: For extreme overextension zones.
- Green and Red: For primary trading ranges.
- Yellow and White: For stall points and neutral zones.
This color-coding ensures that critical data pops against the background, allowing you to react to price pivots the moment they occur during volatile sessions like the London or New York opens.
Elevate Your MetaTrader Terminal
Whether you are a day trader looking for intraday scalp levels or a swing trader identifying long-term structural shifts, the AY MML Dashboard V1.1 is your gateway to systematic trading. By combining the timeless logic of Murrey Math with modern dashboard technology, you gain a competitive edge that streamlines your analysis and focuses your capital on the best opportunities.
3 Downloads
Last Update:
Apr 19, 2026 21:56 PM
Published:
Feb 03, 2026 19:02 PM
Category: