Mastering Volatility with the Average Change High Low Indicator
In the competitive landscape of Forex trading, understanding volatility is just as important as predicting direction. While most indicators focus solely on price trends, the Average Change High Low indicator provides a deep dive into market range and price intensity. By calculating the mean variance between periodic highs and lows, this tool allows traders to quantify market "noise" and identify high-probability breakout zones.
The Science of Price Range Analysis
The Average Change High Low indicator is a volatility-based oscillator that tracks the fluctuating distance between the highest and lowest prices over a specific set of bars. Unlike the Average True Range (ATR), which includes gaps in its calculation, this indicator focuses strictly on the intraday or intra-period movement.
When the indicator shows a rising line, it suggests that the "battle" between buyers and sellers is intensifying, leading to wider price swings. Conversely, a declining line indicates a period of consolidation or "squeezing," where the market is catching its breath.
Why Every Trader Needs a Volatility Filter
Trading without a volatility gauge is like driving in a fog. The Average Change High Low indicator serves as your high-powered fog light in several ways:
- Validating Breakouts: A breakout from a support or resistance level is much more likely to be genuine if it is accompanied by a spike in the Average Change High Low. This confirms that there is real momentum behind the move.
- Setting Smart Stop-Losses: By understanding the average price swing of the current market environment, you can set stop-losses that are outside the range of normal market noise, preventing "stop-hunts" from ruining your trade.
- Identifying Market Exhaustion: Extreme peaks in the indicator often correlate with market climaxes. When volatility reaches an unsustainable high, it is frequently a sign that the current trend is about to reverse or enter a long period of sideways movement.
Applying the Data to Your Strategy
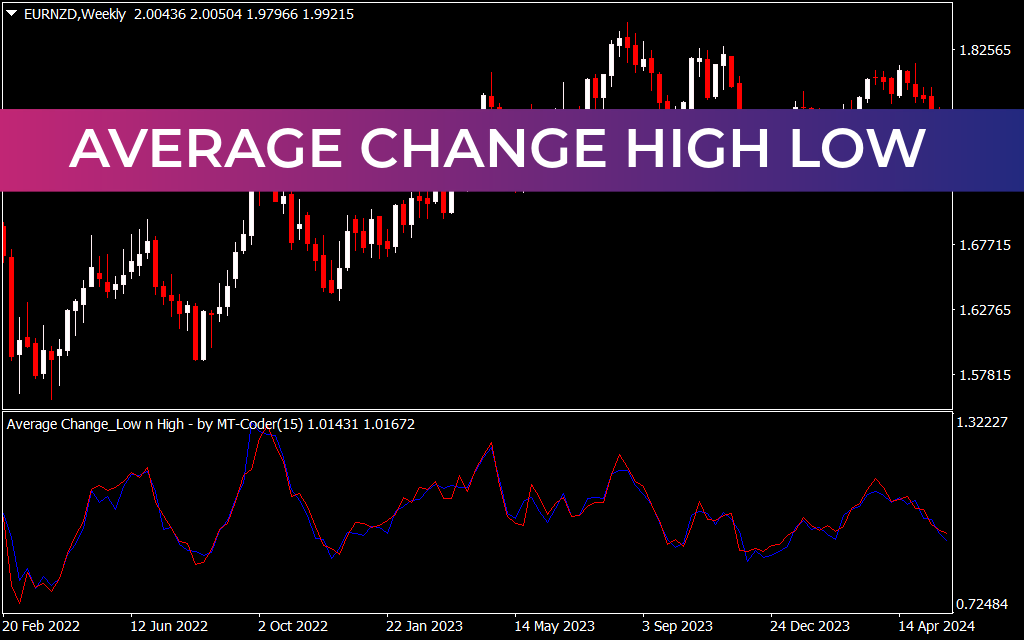
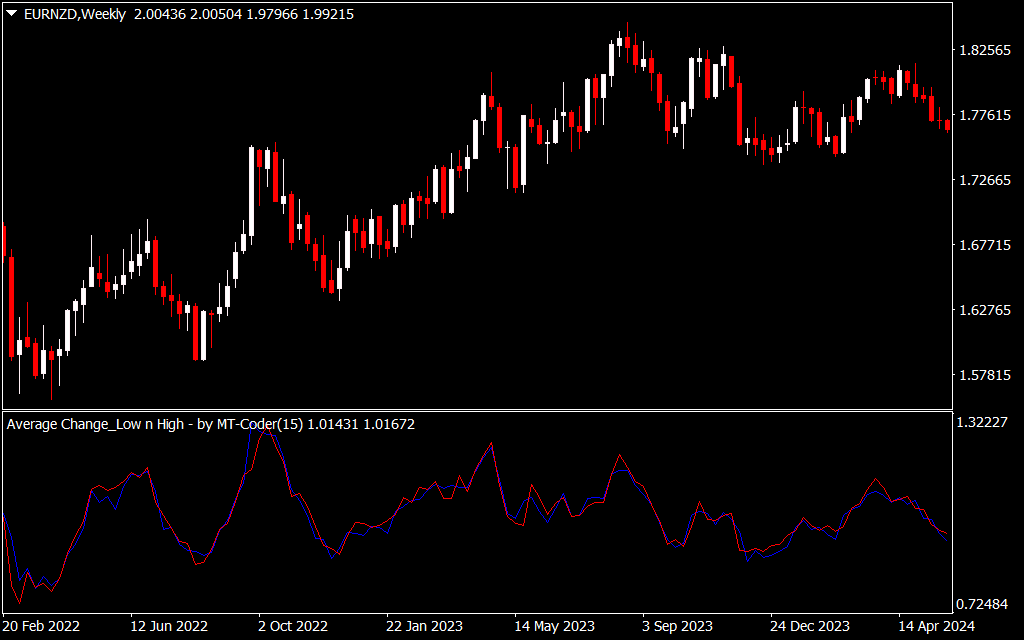
As evidenced in the EURNZD Weekly chart, the Average Change High Low (often seen with period settings like 15) helps swing traders stay patient. During periods of low volatility (low indicator values), it is often best to stay on the sidelines or look for "mean reversion" trades. When the indicator begins to slope upward from a bottom, it signals that a new, volatile cycle is beginning—perfect for trend-following strategies.
The dual-line visualization (typically featuring a fast and slow smoothing) allows for crossover analysis. When the faster line crosses above the slower average, it indicates an immediate surge in Price Action. This is the "engine start" signal that many professional traders use to scale into positions.
Conclusion
The Average Change High Low indicator is an indispensable tool for anyone looking to master market dynamics. By shifting your focus from "where" the price is going to "how" it is moving, you gain a structural advantage that standard indicators simply cannot provide.
6 Downloads
Last Update:
Apr 26, 2026 16:15 PM
Published:
Feb 02, 2026 02:17 AM
Category: