Decoding Daily Direction with the D Trends Indicator
In the financial markets, aligning your trades with the dominant daily trend is one of the most reliable ways to boost your win rate. For intraday scalpers and day traders, however, short-term market noise can easily obscure the bigger picture. A minor price spike on a 5-minute chart might look like a massive structural reversal, trapping retail traders on the wrong side of the market. The D Trends indicator solves this dilemma by calculating and projecting foundational daily trend data directly onto your lower-timeframe MetaTrader charts.
The Value of Daily Trend Filtering
To build a consistent trading edge across liquid currency pairs like EURUSD, GBPUSD, or USDJPY, you must know which entity—buyers or sellers—controls the macro narrative. Institutional players, banks, and hedge funds base their core directional bias on daily charts.
The D Trends indicator works as an automated multi-timeframe dashboard filter. It handles the backend calculations of higher-period price distributions, tracking the daily candle open, previous session ranges, and structural market speed. Instead of forcing you to flip back and forth between different chart screens, it synthesizes this information into an intuitive, real-time map on your current workspace.
Navigating the Visual Interface
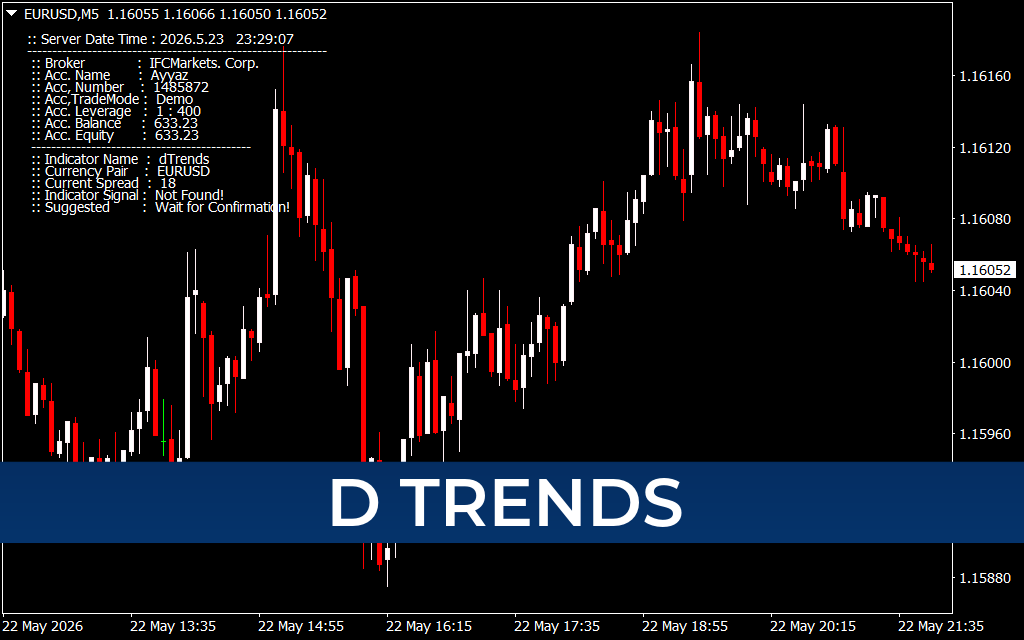
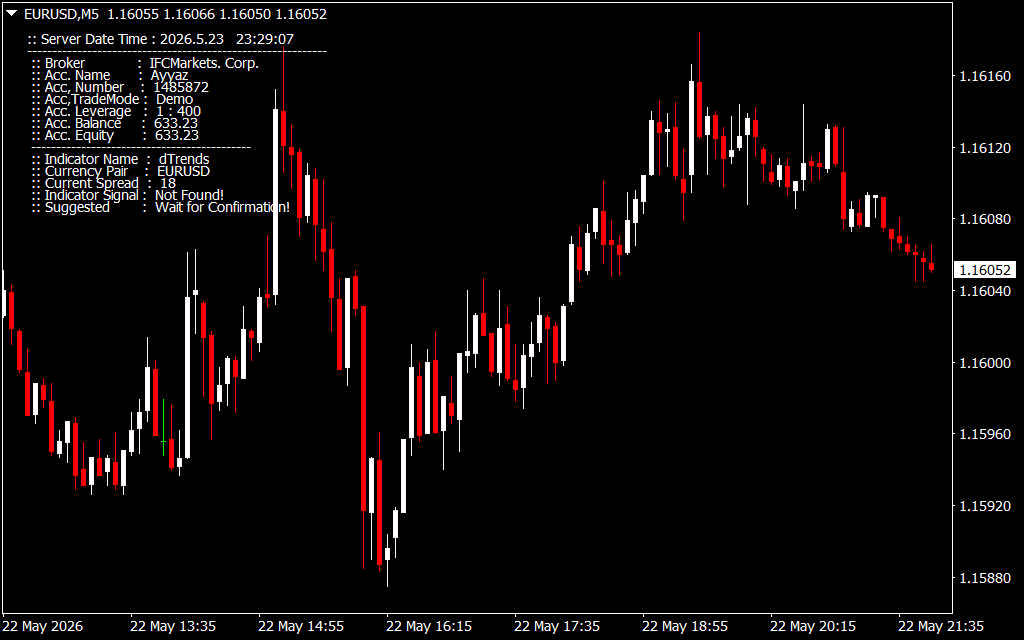
As clearly displayed on the EURUSD 5-minute (M5) chart, the D Trends indicator leaves your main candle screen entirely clean and uncluttered. It moves complex data streams into a dedicated dashboard overlay located in the upper portion of your active window:
- The Daily Trend Label: The indicator displays clear typographic text explicitly reading "Daily trend:" followed by a real-time directional reading.
- Color-Coded Market States: When the higher-timeframe trend is aggressively moving downward, the indicator flashes a distinct red signal reading "DOWN". Conversely, when macro buyers are in control, it registers a bright green "UP" status.
This strategic layout keeps your main window completely readable. You can focus your undivided attention on tracking localized order blocks, fair value gaps, and clean candlestick configurations while remaining fully aware of the institutional tide.
Executing a Rules-Based Trading Strategy
The D Trends indicator serves as an exceptional foundation for mechanical technical systems, matching perfectly with trend-continuation or Smart Money Concepts (SMC) frameworks.
For maximum consistency, day traders can use it as an absolute rule filter. If the D Trends dashboard displays a red "DOWN" status, you should strictly hunt for short configurations on your execution charts. When a short-term corrective pullback moves upward to test an intraday resistance zone or liquidity pool, the macro daily trend acts as a natural shield. The moment price prints a candlestick rejection pattern in that zone, you can execute a tight-risk s
1 Download
Last Update:
May 24, 2026 02:30 AM
Published:
Jan 15, 2026 19:40 PM
Category: