Mastering Market Volatility with the ATR Indicator
In the world of technical analysis, Price Action is often the primary focus for traders. However, understanding the intensity of that movement—its volatility—is what separates professional risk managers from amateur speculators. The Average True Range (ATR) indicator is the industry standard for measuring market volatility, providing traders with an objective, data-driven look at how much an asset typically moves over a given period.
What is the ATR Indicator?
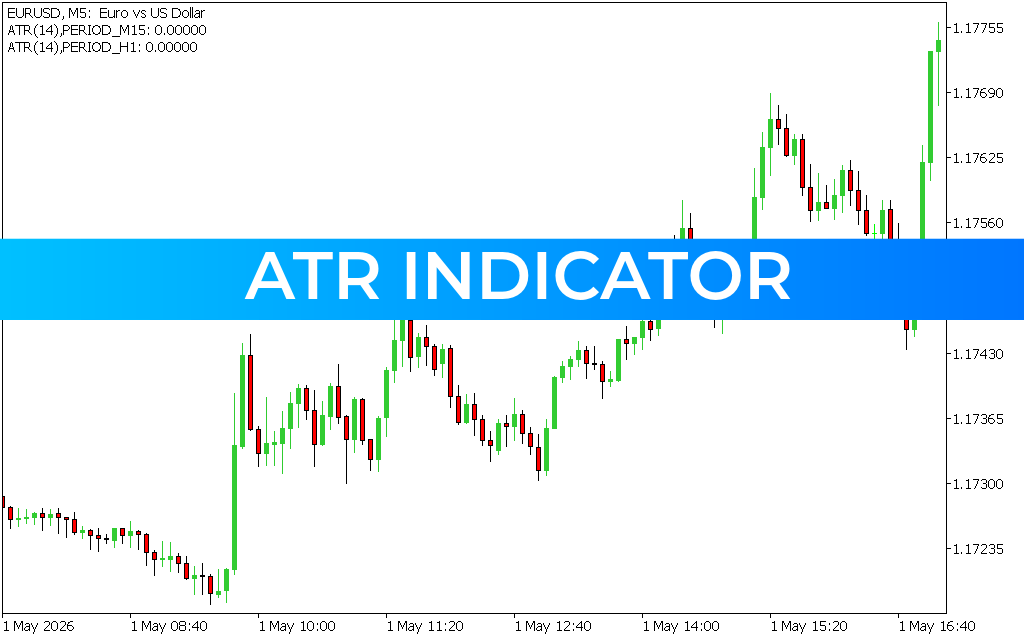
Developed by J. Welles Wilder Jr., the ATR does not predict the direction of a trend. Instead, it measures the "energy" behind the price. As shown in the provided EUR/USD M5 chart, the ATR (14) serves as a vital secondary filter. It calculates the greatest of three values: the current high minus the current low, the absolute value of the current high minus the previous close, and the absolute value of the current low minus the previous close.
By averaging these "True Ranges" over a set period (typically 14 bars), the indicator produces a single value representing the average pip or point movement of the current timeframe.
The Strategic Value of Measuring Volatility
Trading without an understanding of volatility is a primary cause of premature stop-outs. The ATR indicator provides three essential functions for any trading system:
- Dynamic Stop-Loss Placement: A "fixed" 20-pip stop-loss may work during quiet Asian sessions but will be easily hit during a volatile New York open. By using a multiple of the ATR (e.g., 2.0 x ATR), you can place stops that are outside the range of normal market "noise."
- Trade Filtering: High ATR values often signal the climax of a move or extreme panic, while low values suggest consolidation. Professional traders often wait for an ATR "breakout"—where volatility begins to rise from a low base—to enter a new trend.
- Position Sizing: If volatility is high, a trader might reduce their lot size to maintain the same dollar-at-risk. Conversely, in low-volatility environments, larger positions can be taken safely.
Implementation: Day Trading and Scalping
In the attached M5 chart of EUR/USD, notice how the ATR helps contextualize the aggressive bullish move seen between 10:00 and 16:40. During these periods of expansion, the ATR value rises, alerting the trader that wider profit targets and trailing stops are necessary to capture the full extension of the move.
For scalpers operating on the 1-minute or 5-minute charts, the ATR is indispensable for determining if a spread is too wide relative to the expected move. If the ATR value is only slightly higher than the broker's spread, the trade lacks the necessary "headroom" to be profitable.
Conclusion
The Average True Range is a cornerstone of professional technical analysis. It is an essential utility for anyone looking to build a robust, volatility-adjusted trading plan. By integrating the ATR into your MetaTrader workstation, you move beyond guessing and start managing your trades based on the mathematical reality of market movement.
4 Downloads
Last Update:
May 03, 2026 01:30 AM
Published:
Jan 28, 2026 21:57 PM
Category: