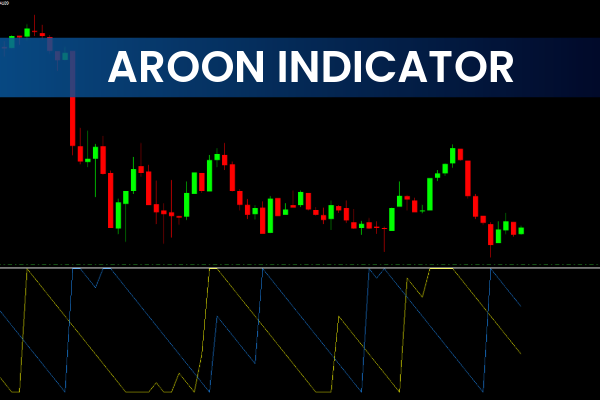
The Aroon Indicator is a powerful but often overlooked market analysis tool created by Tushar Chande in 1995. Although less known than RSI or MACD, the Aroon Indicator is equally effective—if not superior—in detecting trend direction, Trend Strength, momentum shifts, and consolidation zones. The Aroon Indicator for MT4 helps traders determine whether the market is trending upward, downward, or moving sideways while providing early warnings of potential reversals. This makes it a valuable tool for both beginners and advanced traders.
How the Aroon Indicator Works
The indicator consists of two lines: Aroon Up and Aroon Down.
Aroon Up measures how long it has been since price reached its most recent high.
Aroon Down measures the time since price reached its most recent low.
Both values oscillate between 0 and 100, generating signals that help traders interpret market behavior.
Reading Aroon Up and Aroon Down
When Aroon Up is above Aroon Down, the market is trending upward.
When Aroon Up crosses above the 50 level, it indicates a strong uptrend.
When Aroon Down stays below 30, selling pressure is weak, supporting bullish momentum.
When Aroon Down is above 50, it signals a strong downtrend.
If Aroon Up is near zero, it confirms persistent bearish conditions.
When both lines stay close together, the market is typically consolidating.
Trend Strength and Reversal Signals
Aroon values near 100 show strong Trend Continuation, while drops toward 30 or lower suggest weakening momentum. When a line falls to zero, it indicates the trend may soon reverse.
These trend-strength signals enable traders to anticipate buying or selling pressure, identify retracements, and avoid false breakouts.
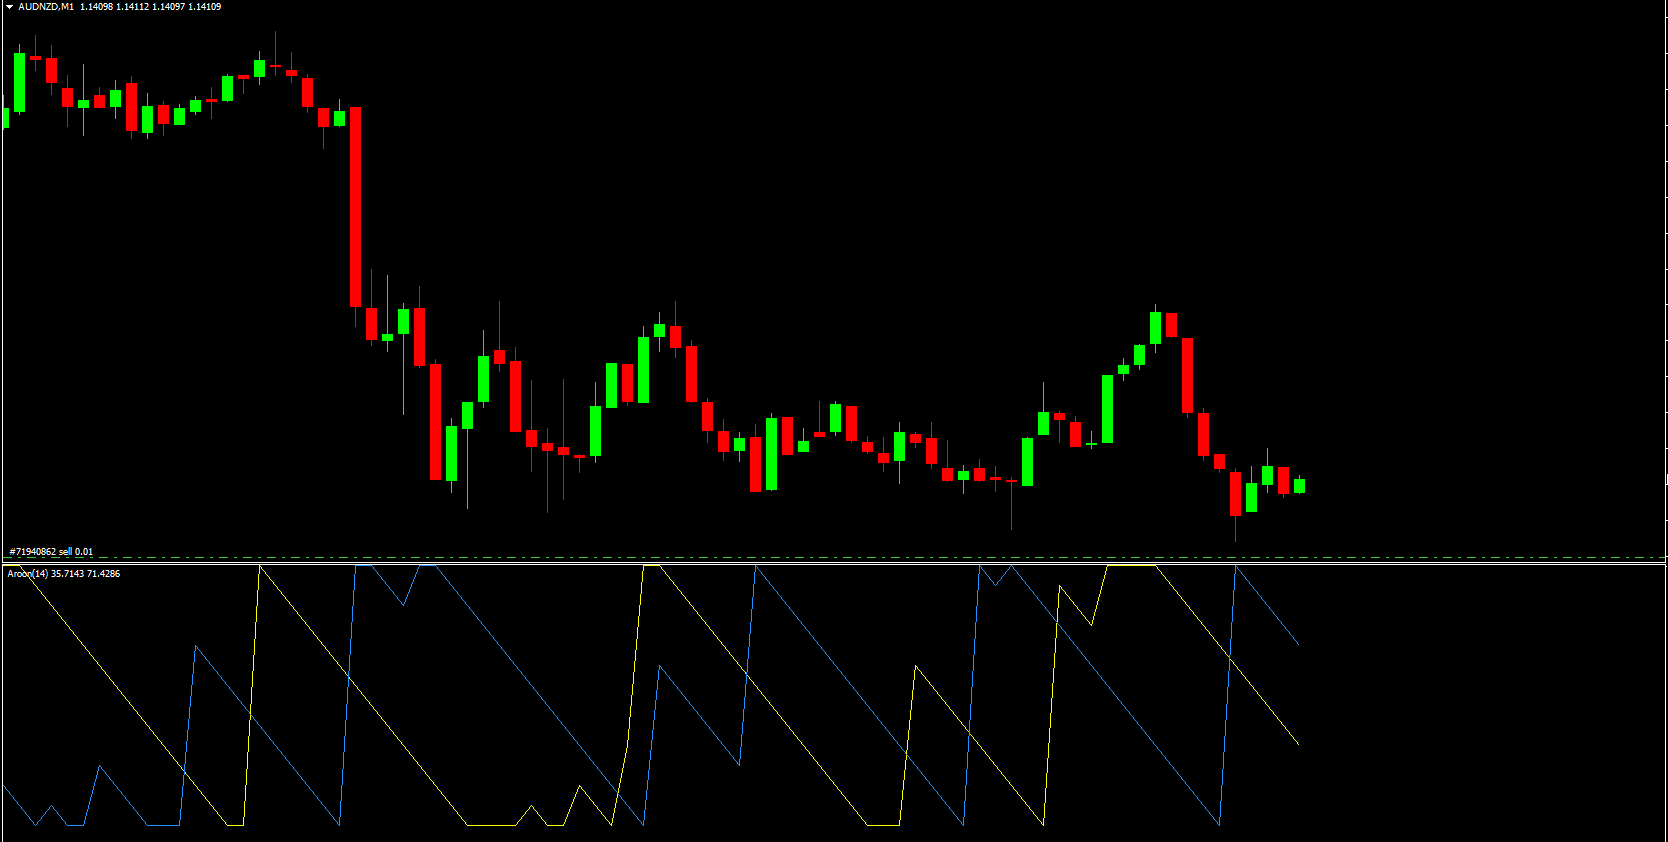
Chart Example Explained
Consider the EUR/NZD example:
Strong Downtrend Scenario
In the highlighted red-circled area, the Aroon Down (blue) stays close to the 100 level, confirming strong bearish dominance. At the same time, the Aroon Up (yellow) remains around the zero area, showing no buying pressure. Price Action mirrors this, maintaining a steady downtrend that validates the Aroon signal.
Strong Uptrend Scenario
During the green-circled region, the Aroon Up (yellow) hovers near the 100 mark, signaling a solid uptrend. The blue Aroon Down line remains near zero, indicating minimal bearish influence. Price movement climbs steadily, aligning perfectly with the Aroon Indicator's reading.
Why Use the Aroon Indicator for MT4?
Helps Identify Trend Direction
Quickly determine if the market is trending upward, downward, or sideways.
Measures Momentum and Strength
Aroon readings reveal the intensity of buying or selling pressure.
Detects Potential Reversals
When either line weakens or crosses key zones, traders can anticipate price transitions.
Ideal for Trend-Following Strategies
The Aroon Indicator helps traders ride established trends smoothly without being shaken out prematurely.
Works Well with Other Tools
Pairing Aroon with indicators like MACD, RSI, or Stochastic Oscillator helps validate signals and improve accuracy.
How to Use the Aroon Indicator Effectively
Look for Aroon Up above 70 to confirm strong bullish trends.
Look for Aroon Down above 70 to confirm strong bearish conditions.
Avoid trading when both lines stay close together—this usually means consolidation and low-quality setups.
Combine Aroon with support/resistance, price action, and trendlines for accuracy.
Use Aroon on higher timeframes to identify major trend phases before placing entries on smaller charts.
Conclusion
The Aroon Indicator for MT4 is an excellent tool for identifying trends, measuring momentum, and anticipating price reversals. Whether you want to trade pullbacks, ride established trends, or filter out market noise, this indicator offers valuable market insights. Try it in your strategy and experience how effectively it highlights trend strength and turning points.
To download more premium and free indicators, visit IndicatorForest.com today.
FAQ
Published:
Nov 25, 2025 22:08 PM
Category: