The All CCI Indicator for MetaTrader 4 is a powerful version of the Commodity Channel Index (CCI) that helps traders view market conditions across multiple timeframes simultaneously.
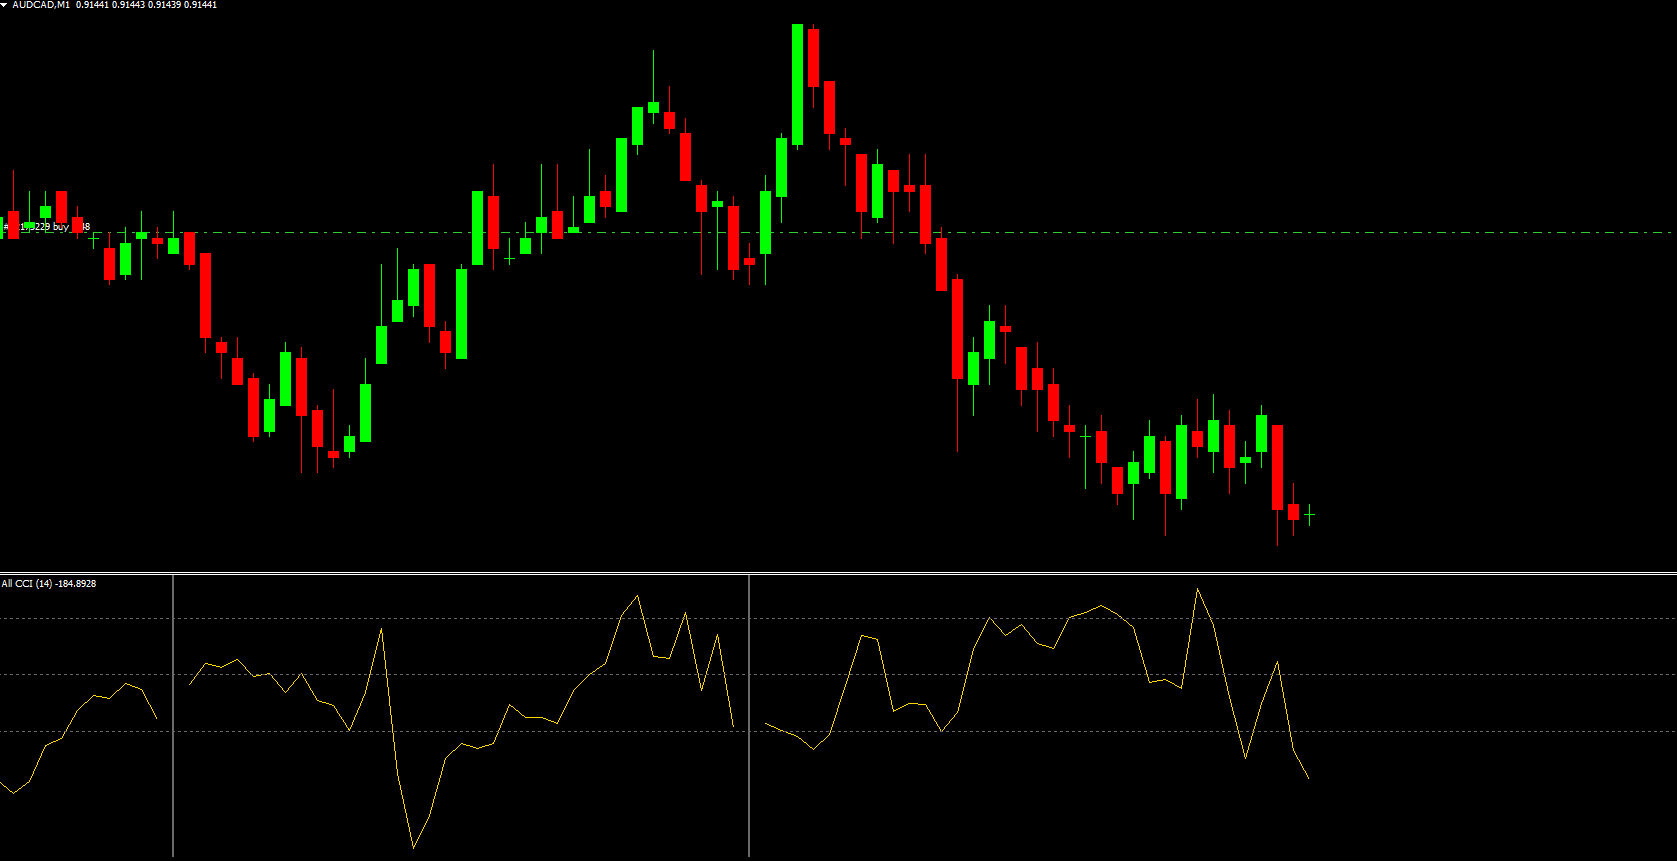
While the traditional CCI measures the difference between the current price and its average over a specific period, the All CCI Indicator expands this functionality by displaying CCI readings for all major timeframes—from monthly to 15-minute charts—all in one window.
This comprehensive view allows traders to analyze both short-term and long-term market momentum, identifying whether a currency pair is in overbought or oversold territory across different horizons.
How the All CCI Indicator Works
The Commodity Channel Index (CCI) typically oscillates between +100 and -100:
Above +100: The market is overbought, signaling a potential sell opportunity.
Below -100: The market is oversold, signaling a potential buy opportunity.
Around 0: Indicates a neutral market with balanced momentum.
The All CCI Indicator takes this a step further by plotting the CCI values of multiple timeframes side by side. For example, on an AUD/USD chart, you can view:
Monthly CCI
Weekly CCI
Daily CCI
Hourly CCI
15-minute CCI
This gives traders a complete picture of the trend strength and direction across all market conditions.
Benefits of Using the All CCI Indicator
Comprehensive Market View
Traders can instantly see whether the higher and lower timeframes align. For instance, if the daily and hourly CCIs are both above +100, the bullish momentum is confirmed.
Reduced False Signals
By analyzing multiple timeframes at once, traders can filter out noise and avoid taking trades against the dominant trend.
Better Entry and Exit Timing
Use higher-timeframe CCIs (weekly/monthly) to determine the major trend direction.
Use lower-timeframe CCIs (H1/M15) to pinpoint entry and exit points.
Flexible Across Trading Styles
The indicator suits all trader types:
Scalpers: Use short-term CCIs for fast entries.
Day traders: Combine H1 and H4 CCIs for intraday trends.
Swing traders: Follow daily and weekly CCIs for longer-term setups.
Customizable Settings
You can adjust the indicator parameters (such as CCI period and timeframe display) to match your trading approach.
Trading With the All CCI Indicator
Buy Setup Example
The CCI readings on higher timeframes (e.g., D1, H4) are below -100 (oversold).
Lower timeframe (e.g., H1 or M15) begins crossing above -100.
Enter a BUY trade once momentum confirms on both the lower and higher timeframe CCIs.
Sell Setup Example
The CCI readings on higher timeframes are above +100 (overbought).
The lower timeframe CCI crosses below +100, signaling a reversal.
Enter a SELL trade as multiple CCIs align in the same direction.
Why Choose the All CCI Indicator
Multi-timeframe clarity: View all trends at a glance.
Improved trade confidence: Align short-term setups with long-term momentum.
Universal application: Works across Forex, commodities, indices, and crypto.
Compatible with all trading styles: From Scalping to position trading.
Conclusion
The All CCI Indicator for MT4 provides traders with an advanced way to analyze trend direction, strength, and momentum across all timeframes. By merging long-term and short-term perspectives, it helps minimize false signals and improve trade timing.
Whether you’re a beginner or experienced trader, this indicator can be an invaluable addition to your trading system.
Download the All CCI Indicator for MT4 today at IndicatorForest.com and gain a clearer view of market dynamics across every timeframe.
FAQ
Published:
Nov 11, 2025 11:01 AM
Category: