The ADXDMI MT4 Indicator is a powerful Forex trading tool that combines the functions of two widely used technical indicators — the Average Directional Index (ADX) and the Directional Movement Index (DMI). This hybrid system helps traders identify both the strength and direction of a trend, providing a complete picture of market conditions.
In Forex trading, understanding when a market is trending — and how strong that trend is — can make the difference between a successful trade and a false breakout. The ADXDMI indicator for MT4 helps solve this problem by clearly displaying whether a market is trending and in which direction (bullish or bearish).
This indicator works on all currency pairs and timeframes, making it a versatile choice for scalpers, swing traders, and long-term investors alike.
How the ADXDMI MT4 Indicator Works
The ADXDMI indicator combines two analytical tools:
Average Directional Index (ADX): This measures the strength of a trend without considering its direction. A rising ADX value means the trend is getting stronger, while a falling ADX suggests weakening momentum or consolidation.
Directional Movement Index (DMI): This part identifies the direction of the trend using two lines:
+DI (Positive Directional Index): Represents bullish pressure (buyers).
–DI (Negative Directional Index): Represents bearish pressure (sellers).
When combined, these components provide a dynamic view of the market’s energy, allowing traders to identify high-probability trading opportunities with more confidence.
Understanding the ADXDMI Indicator Components
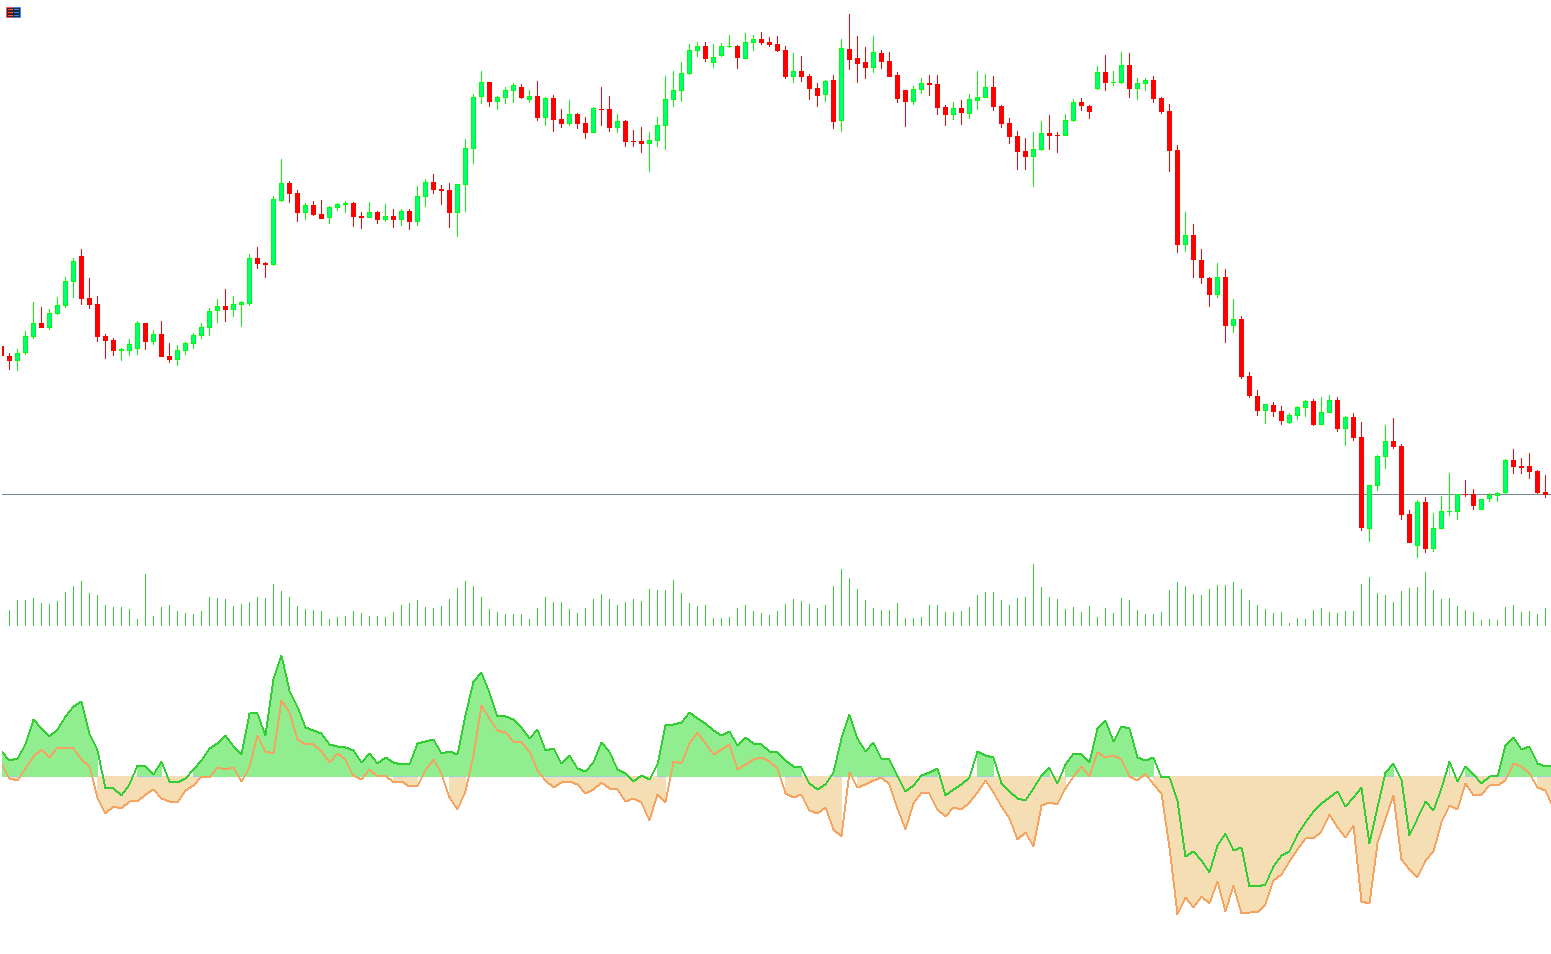
On the chart, the ADXDMI indicator displays three lines:
White Line (ADX): Measures the trend’s overall strength. The higher it rises, the stronger the trend.
Green Line (+DI): Indicates bullish market momentum.
Wheat/Orange Line (–DI): Indicates bearish market momentum.
When the +DI crosses above the –DI, it signals a potential buy opportunity. Conversely, when the –DI crosses above the +DI, it suggests a possible sell signal.
However, for the most reliable trades, it’s best to look for these crossovers when the ADX line is rising — this confirms that the trend (either bullish or bearish) has enough strength to sustain a move.
How to Trade with the ADXDMI MT4 Indicator
Buy Setup (Bullish Signal)
Wait for the +DI (green) line to cross above the –DI (orange) line.
Confirm that the ADX (white) line is rising above 25, indicating a strengthening trend.
Enter a buy trade at the candle close.
Place a stop loss below the most recent swing low.
Take profit when the –DI line begins to rise above the +DI, or when the ADX starts to flatten.
Sell Setup (Bearish Signal)
Wait for the –DI (orange) line to cross above the +DI (green) line.
Ensure the ADX is rising to confirm Trend Strength.
Enter a sell position at the candle close.
Place a stop loss above the recent swing high.
Take profit when the +DI line crosses back above the –DI or when the ADX starts to decline.
Avoid Sideways Markets
If the ADX line is below 20 and moving sideways, it signals a weak trend or range-bound market. It’s best to avoid trading during these periods, as false signals are more likely.
Example of ADXDMI in Action
Let’s take an example using the EUR/USD on the H1 timeframe:
The +DI (green) crosses above the –DI (orange) line.
The ADX (white) rises above the 25 level, confirming trend strength.
A bullish candle forms, validating a buy entry.
The trader enters a long position with a stop loss below the previous low.
As the ADX continues to climb, the uptrend strengthens, leading to profitable trade continuation.
This practical setup demonstrates how traders can combine ADX and DMI readings for high-accuracy trading signals.
Advantages of Using the ADXDMI MT4 Indicator
Accurate Trend Identification: Quickly distinguishes between strong and weak market conditions.
Dual Functionality: Combines both trend strength and direction in one window.
Reduces False Entries: Filters out weak or choppy markets.
Works on All Timeframes: From M1 to Monthly charts.
Compatible with Other Tools: Can be paired with moving averages, RSI, or Price Action setups for confirmation.
By integrating the ADXDMI indicator into your trading strategy, you gain better clarity and precision in identifying profitable entry and exit points.
Conclusion
The ADXDMI Indicator for MT4 is an essential tool for traders who rely on technical trend analysis. It combines the strength-measuring power of ADX with the directional accuracy of DMI to provide reliable, data-driven trading signals.
For best results, use the indicator in conjunction with other tools like moving averages or candlestick patterns to confirm trade setups.
You can download the ADXDMI MT4 Indicator for free at IndicatorForest.com and start improving your Forex trend-trading strategy today.
FAQ
1 Download
Published:
Nov 07, 2025 05:16 AM
Category: