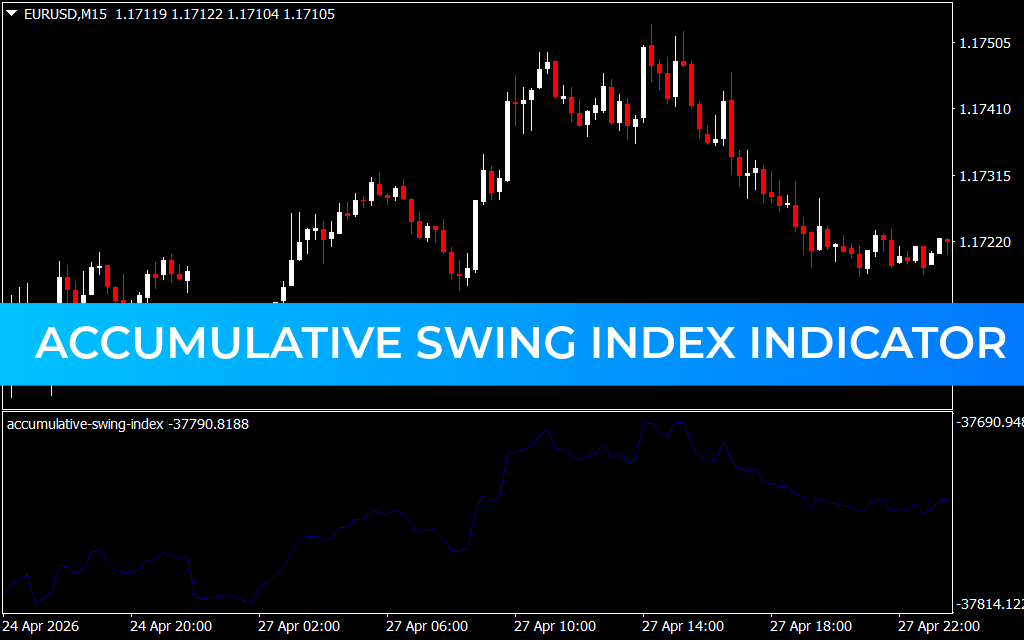
Mastering the Accumulative Swing Index (ASI): A Guide for Precision Traders
In the high-stakes world of technical analysis, traders are constantly seeking indicators that cut through market noise to reveal the "true" Price Action. Developed by the legendary Welles Wilder, the Accumulative Swing Index (ASI) is a sophisticated tool designed to do exactly that. While simple oscillators track momentum, the ASI is a cumulative total of the Swing Index, providing a running view of the market's long-term strength and direction.
Download Accumulative Swing Index for free. Master market trends and identify high-probability breakouts with this precision technical analysis tool.
What is the Accumulative Swing Index?
The ASI is essentially a "phantom" line that tracks the collective swings of a market. Unlike standard price charts, which can be distorted by temporary spikes or gaps, the ASI uses a complex formula comparing current and previous open, high, low, and close prices. It factors in the Limit Move (the maximum price change allowed in a session), making it particularly effective in volatile markets.
The core purpose of the ASI is to confirm price trends and identify potential breakouts that might not be obvious on a standard candlestick chart.
Key Benefits of Using ASI in Trading
- Trend Confirmation: When the ASI is in an uptrend, it confirms a bullish market. If price hits a new high but the ASI fails to do so, it signals a potential Trend Reversal.
- Breakout Validation: Wilder believed that if the ASI breaks a previous swing high or low, it constitutes a "real" breakout. This helps traders filter out "fakeouts" that often trap retail investors.
- Support And Resistance: The ASI often reflects support and resistance levels more clearly than the price chart itself, allowing for more precise entries and exits.
How to Trade with the ASI Indicator
Successful integration of the ASI involves looking for divergences and trendline breaks.
- The Trendline Break: Draw trendlines directly on the ASI indicator window. A breakout on the ASI often precedes a breakout on the price chart, giving you a head start on the move.
- Divergence Trading: If the EUR/USD is making higher highs but the ASI is making lower highs, the upward momentum is exhausting. This bearish divergence is a strong signal to tighten stop-losses or look for short opportunities.
- The 0-Line Cross: While less common than divergence, some traders use the centerline as a gauge for long-term sentiment shifts.
Conclusion
The Accumulative Swing Index is more than just a momentum oscillator; it is a comprehensive look at the market's inner workings. By focusing on the relationship between successive trading sessions, it offers a grounded perspective that pure price action sometimes obscures. Whether you are Scalping the M15 timeframe or position trading, the ASI is a powerhouse for validating your strategy.
1 Download
Last Update:
Apr 29, 2026 13:32 PM
Published:
Jan 31, 2026 10:48 AM
Category: