Mastering Market Sentiment with the Absolute Strength Histogram
In the fast-paced arena of financial trading, the ability to distinguish between a minor price fluctuation and a significant shift in market power is what separates profitable traders from the rest. While many indicators focus solely on price, the Absolute Strength Histogram is designed to measure the underlying vigor of bulls and bears. By visualizing the relative dominance of market participants, this tool provides a clear, objective roadmap for Trend Following and reversal trading.
What is the Absolute Strength Histogram?
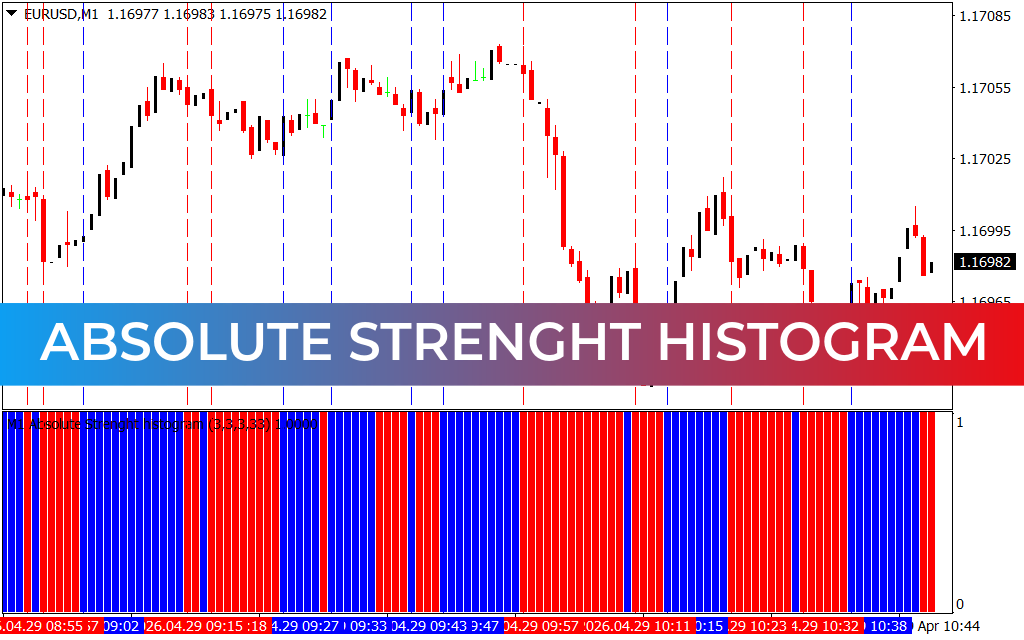
The Absolute Strength Histogram is a momentum-based technical indicator that decomposes market movement into two distinct forces: bullish strength and bearish strength. Unlike a standard line oscillator that might oscillate around a zero point, the histogram provides a vertical, color-coded representation of which side currently holds the "reins" of the market.
Typically, the indicator uses a combination of moving averages and price range calculations (often involving RSI or Stochastic math) to determine "Absolute Strength." The result is a highly visual bar chart—usually appearing in red and blue—that makes market sentiment instantly readable.
Key Benefits of the Histogram Format
The transition from a line-based indicator to a histogram offers several strategic advantages:
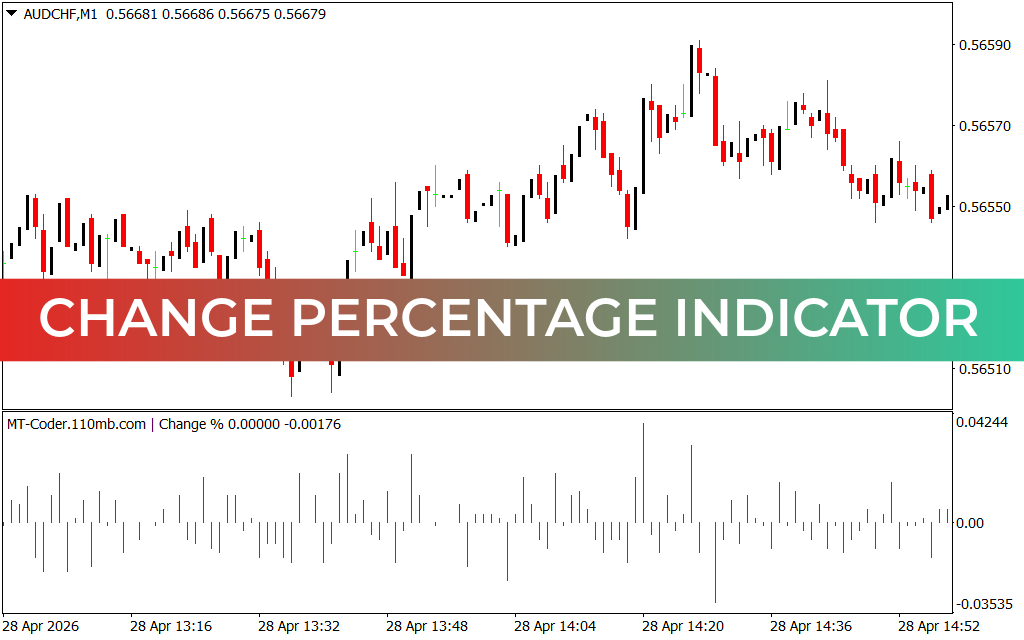
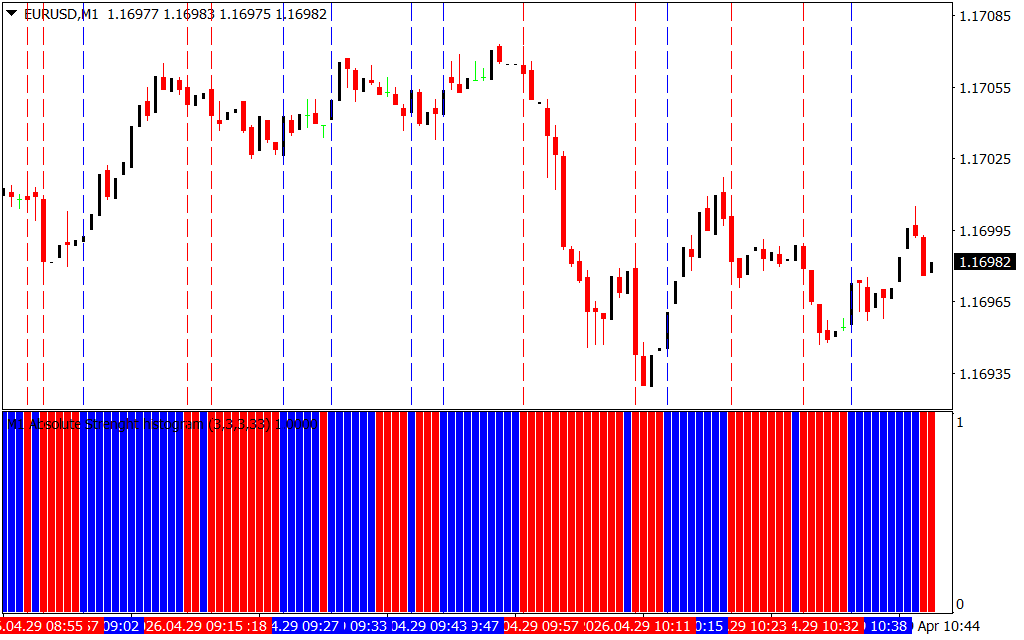
- Immediate Visual Confirmation: On a 1-minute (M1) or 5-minute (M5) chart, decisions must be made in seconds. The color-coded bars allow for "glance-and-go" trading, where blue bars signify buyer dominance and red bars indicate seller control.
- Trend Intensity Measurement: The height of the bars represents the magnitude of the strength. Taller bars indicate a high-conviction move, while shorter bars suggest a period of indecision or consolidation.
- Clear Entry and Exit Points: When the histogram flips from red to blue, it signals a potential bullish entry. When it flips back, it indicates the trend may be exhausting, providing a logical exit signal.
Strategic Trading Applications
The Absolute Strength Histogram is a versatile tool that can be integrated into various trading systems:
- Trend Following: In a trending market, the histogram acts as a filter. If you are looking for buy setups, you only execute when the histogram is blue. This prevents you from "catching a falling knife" during bearish pullbacks.
- Scalping Reversals: For high-frequency traders, the vertical lines generated by the indicator on the price chart mark the exact moment sentiment shifts. This is invaluable for catching quick momentum bursts on lower timeframes.
- Divergence Analysis: By comparing the peaks of the histogram with the peaks of the price action, traders can identify when price is making new highs but "Absolute Strength" is failing to follow—a classic sign of an imminent Trend Reversal.
Conclusion
The Absolute Strength Histogram is more than just a Trend Indicator; it is a sentiment gauge that brings transparency to market dynamics. By stripping away the noise of individual candles and focusing on the core strength of the market, it empowers traders to stay on the right side of every move. Whether you are an intraday scalper or a long-term swing trader, this histogram is an essential component for a disciplined, data-driven strategy.
9 Downloads
Last Update:
Apr 29, 2026 13:50 PM
Published:
Jan 31, 2026 02:22 AM
Category: