Master Market Volatility with the Change Percentage Indicator
In the fast-paced world of financial trading, clarity is the difference between a winning streak and a blown account. While standard price charts tell you where the price is, they often fail to illustrate the intensity of the move relative to previous Price Action. This is where the Change Percentage Indicator becomes an essential part of a trader's toolkit. By calculating and visualizing the mathematical shift in price over a specific period, this indicator provides a standardized view of market momentum that raw candlesticks simply cannot match.
Understanding the Change Percentage Logic
At its core, the Change Percentage Indicator calculates the variance between the current price and a historical anchor point (usually the previous candle’s close or the daily open). The formula is straightforward:
Percentage Change=(Previous PriceCurrent Price−Previous Price)×100
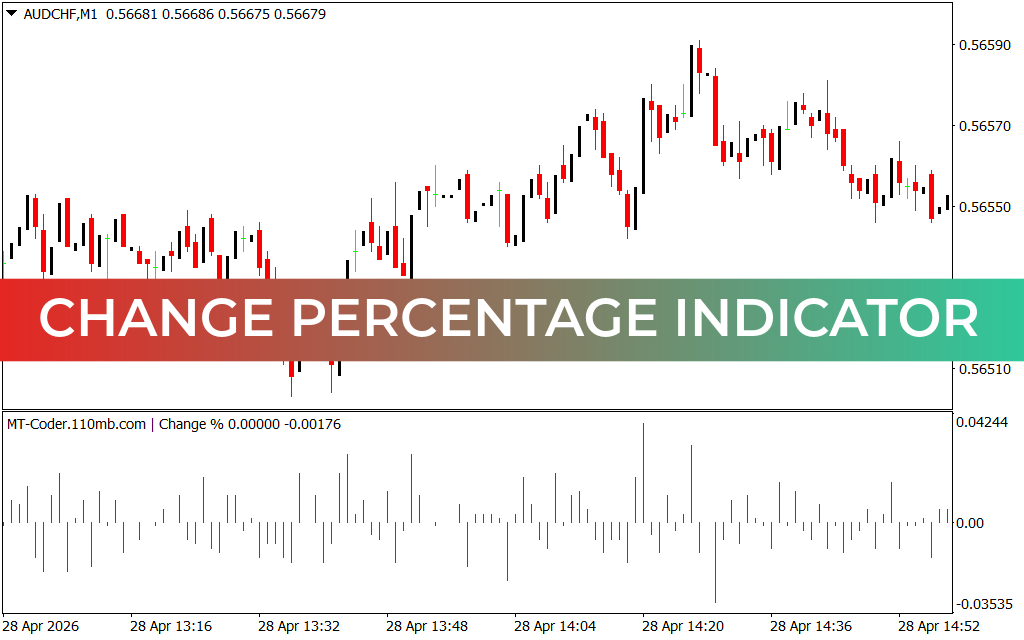
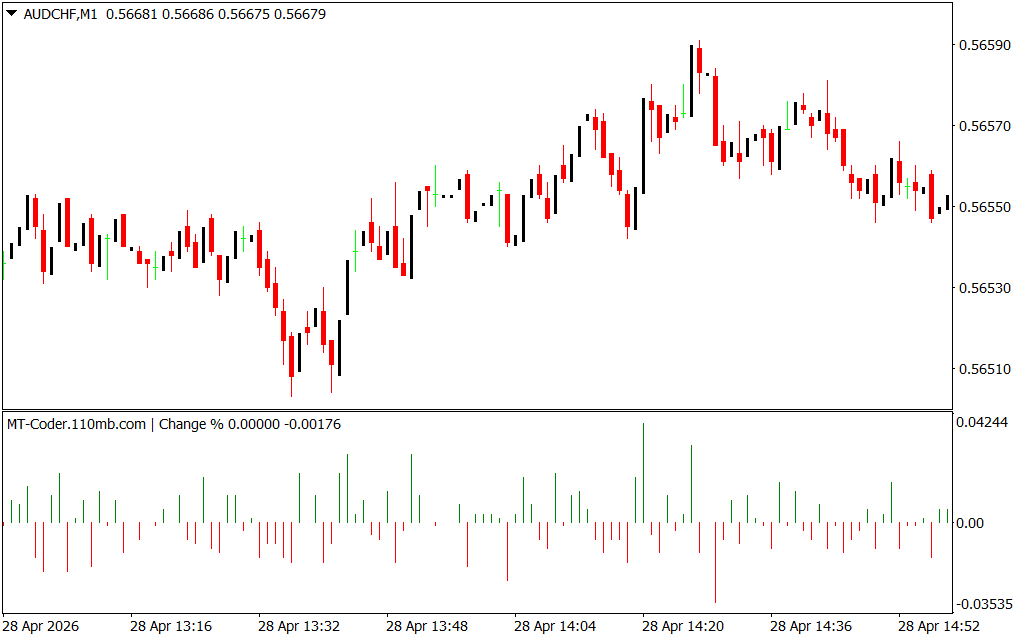
By converting price movement into a percentage, traders can compare different assets—such as the AUD/CHF pair shown in your chart—on an even playing field. Whether an asset is worth $0.50 or $50,000, a 1% move represents the same relative market conviction.
Why Momentum Traders Need This Tool
Standard volume bars show how many shares or contracts changed hands, but they don't always indicate the "quality" of the move. The Change Percentage Indicator, often displayed as a histogram below the main price chart, highlights:
- Volatility Spikes: Large vertical bars (green for positive, red for negative) signal sudden shifts in sentiment, often preceding a breakout.
- Mean Reversion Opportunities: When the percentage change reaches extreme historical levels, it often signals that the market is overextended and due for a retracement.
- Trend Confirmation: Consistent, small positive increments suggest a healthy, sustainable uptrend, whereas erratic, high-percentage swings suggest a chaotic market environment.
Integrating the Indicator into Your Strategy
To get the most out of this tool, look for divergence. If the price is making new highs but the Change Percentage Indicator is showing lower peaks, the momentum is fading. Conversely, a massive spike in percentage change following a period of low volatility often marks the "ignition" phase of a new trend.
For day traders operating on the M1 or M5 timeframes, this indicator is a lifesaver. It filters out the "noise" of minor price fluctuations and allows you to focus on candles that truly move the needle. By setting custom threshold alerts, you can be notified exactly when a pair moves beyond its typical ATR (Average True Range) percentage, ensuring you never miss a high-probability entry.
3 Downloads
Last Update:
Apr 28, 2026 19:36 PM
Published:
Jan 31, 2026 19:39 PM
Category: