Precision Trading with the 3-11 Oscillator: The Ultimate Momentum Secret
In the fast-paced world of financial trading, momentum is the engine that drives profits. For traders who rely on technical analysis, finding an indicator that captures shifts in momentum before they become obvious on the price chart is the "holy grail." Enter the 3-11 Oscillator, a specialized momentum tool designed to bridge the gap between short-term fluctuations and long-term trend sustainability.
What is the 3-11 Oscillator?
The 3-11 Oscillator (often utilized in its 3-10 or 3-11 variation) is a momentum-based indicator that functions similarly to a MACD but with increased sensitivity. It calculates the difference between two simple moving averages—specifically a 3-period and an 11-period average. By comparing a very short-term view of the market with a slightly longer baseline, the oscillator identifies where buying or selling pressure is accelerating.
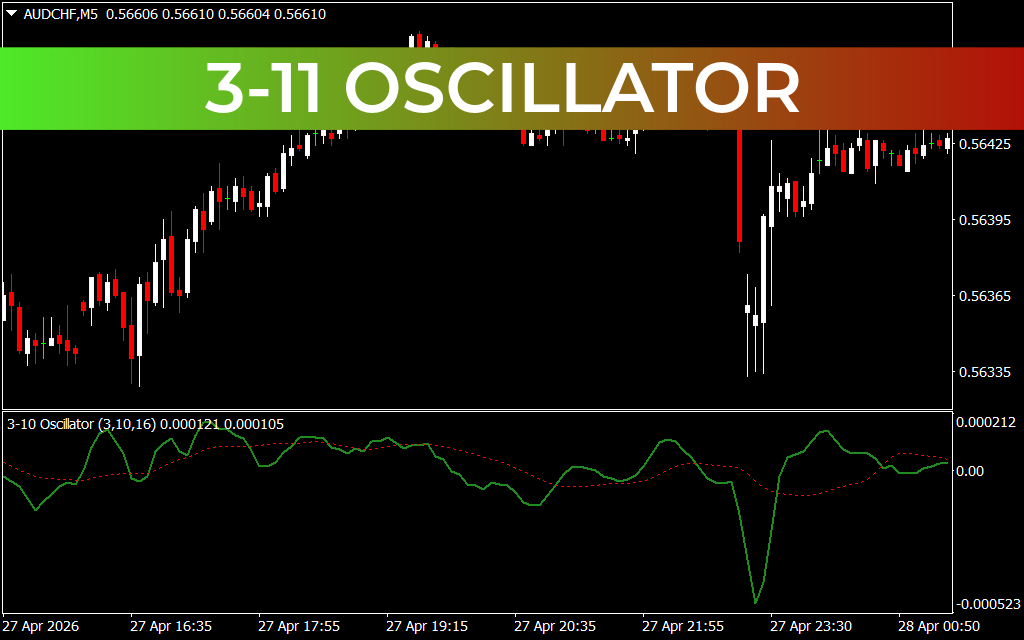
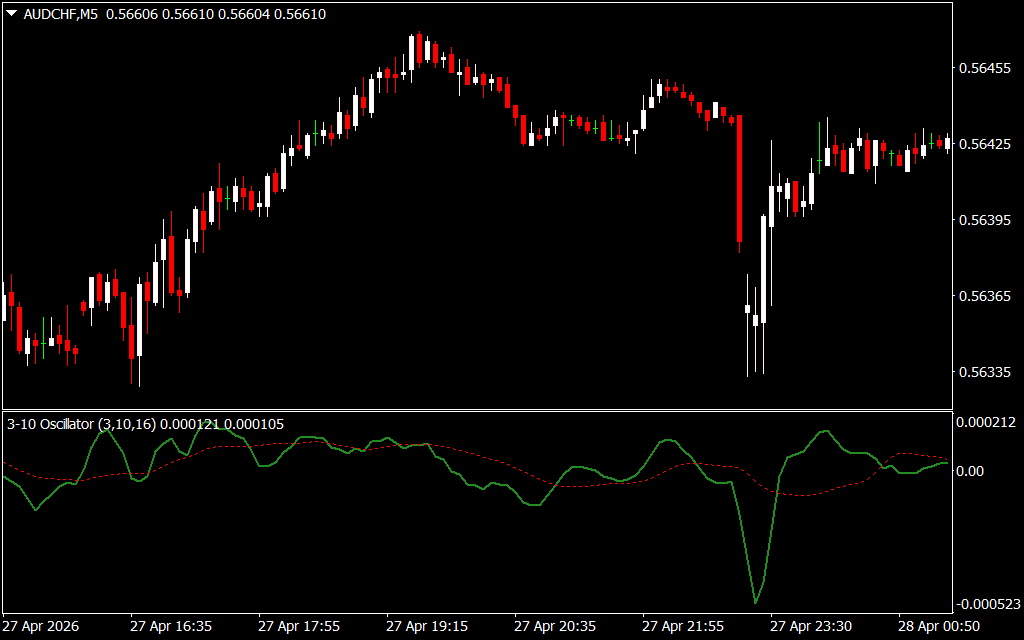
As seen in the AUD/CHF M5 chart, the 3-11 Oscillator consists of a fast-moving line (the oscillator itself) and a slower signal line (often a 16-period simple moving average). This combination allows traders to visualize the "ebb and flow" of market strength with surgical precision.
Key Benefits for Traders
The 3-11 Oscillator is prized for its versatility across various asset classes, from Forex to stocks and commodities. Its primary strengths include:
- Early Trend Detection: Because the 3-period average reacts almost instantly to price changes, the oscillator often crosses the zero line or its signal line well ahead of traditional lagging indicators.
- Divergence Spotting: One of the most powerful ways to use this tool is identifying "divergence"—where price makes a new high, but the oscillator makes a lower high. This is a classic warning sign of an impending reversal.
- Zero-Line Crossovers: The zero line acts as the equilibrium point. When the oscillator crosses above zero, it signals a shift to bullish momentum; a cross below zero indicates bearish control.
How to Trade with the 3-11 Oscillator
For the best results, traders should look for confluence. On a 5-minute chart, a sharp dip in the 3-11 Oscillator that begins to curl back toward the signal line can signal a high-probability entry point for a "buy the dip" strategy within a larger uptrend. Conversely, when the green oscillator line plunges sharply below the red signal line, it warns of a sudden increase in selling pressure, allowing traders to exit positions before a full-scale crash.
By adding the 3-11 Oscillator to your trading arsenal, you gain a transparent view of market psychology. It strips away the confusion of raw Price Action and provides a mathematical foundation for every trade you take.
2 Downloads
Last Update:
Apr 28, 2026 13:57 PM
Published:
Jan 31, 2026 20:08 PM
Category: