Navigate Price Stagnation with the Flat Market Indicator
One of the most significant challenges for any technical trader is the "sideways" market. While trend-following strategies can be incredibly lucrative during periods of high momentum, they often suffer heavy losses when price enters a consolidation or "flat" phase. These periods of stagnation lead to frequent false breakouts and "whipsaws" that can quickly erode a trading account. The Flat Market Indicator is a specialized diagnostic tool for MetaTrader designed to identify these dangerous zones, allowing traders to stay on the sidelines until a high-conviction move returns.
Identifying the "No-Trade" Zone
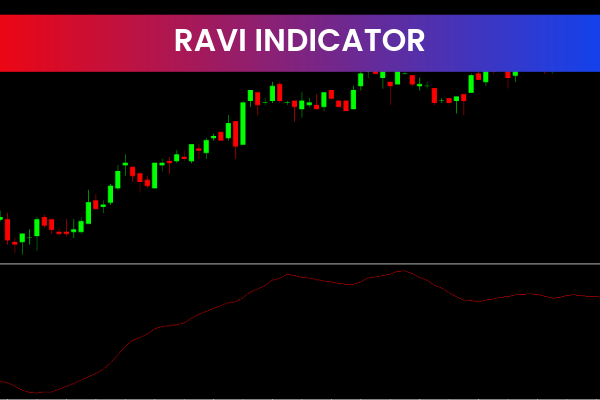
The Flat Market Indicator operates as a momentum-based histogram in a sub-window, providing a real-time assessment of market energy. Unlike standard oscillators that attempt to find tops and bottoms, this indicator focuses on the absence of direction. By analyzing the relationship between price velocity and volatility, it categorizes the market state into actionable visual signals.
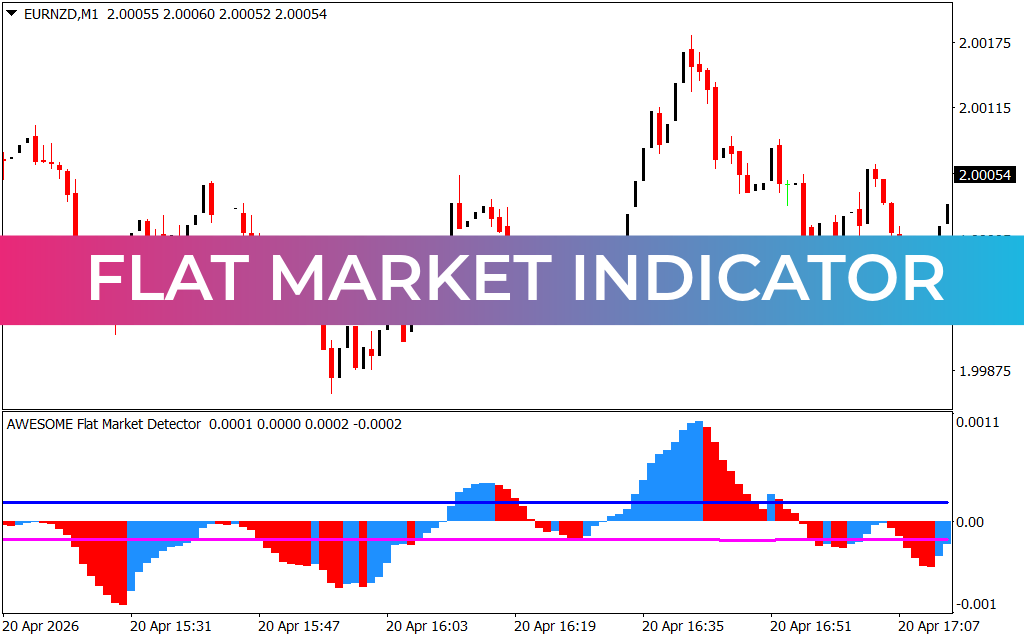
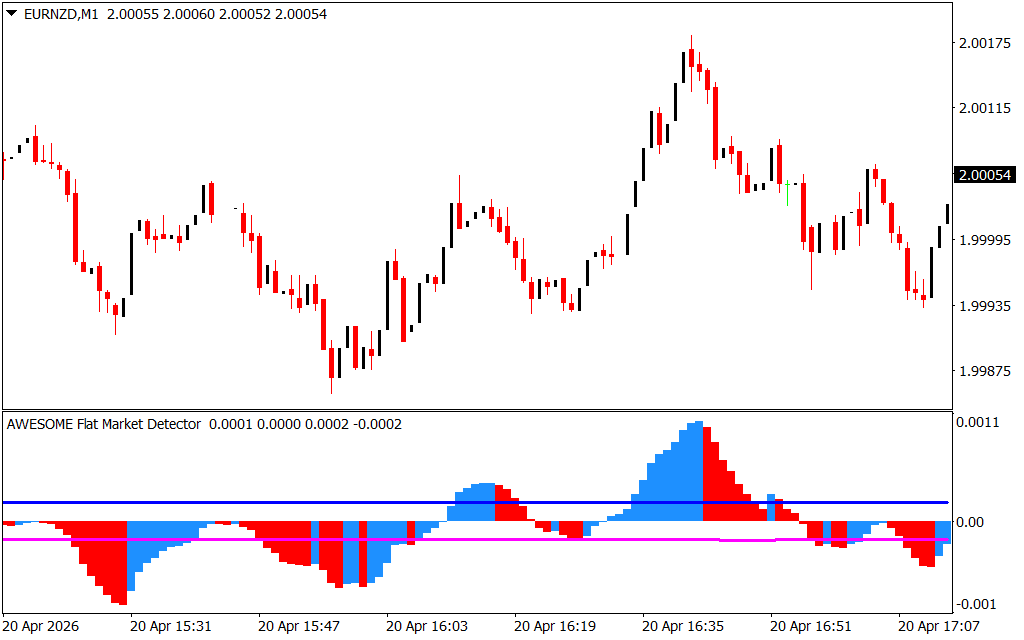
As seen on the EURNZD M1 chart, the indicator provides clear visual logic:
- Blue Histogram Bars: Indicate that the market is showing sufficient momentum to be considered a "trending" state. These are the periods where trend-following systems are most effective.
- Red Histogram Bars: Signal a "flat" or consolidating market. In this state, the indicator suggests that Price Action is random and lacks a dominant buyer or seller presence.
- Zero-Line Thresholds: The indicator utilizes specific horizontal levels to act as a "dead zone" filter. If the histogram remains between these levels, the market is deemed too quiet for reliable trading.
Strategic Execution: Filtering for Success
The primary strength of the Flat Market Indicator is its role as a master filter for your existing trading strategy. Whether you are Scalping the M1 timeframe or swing trading the higher charts, this tool adds a layer of statistical protection to your execution.
- Reducing Whipsaws: By only taking signals from your primary strategy when the Flat Market Indicator is blue, you significantly increase the probability that a breakout will have the momentum required to reach your take-profit target.
- Volatility Awareness: The indicator is particularly useful for traders who use mean-reversion strategies. When the histogram turns red, it signals that price is likely to stay within a tight range, which may be suitable for grid or range-trading bots but a "red flag" for trend followers.
- Optimal Session Timing: During low-liquidity periods, such as the late Asian session, the Flat Market Indicator often highlights prolonged red zones, reminding traders to wait for the London or New York open for better opportunities.
Why Your Trading Dashboard Needs This Tool
The Flat Market Indicator is essentially an "insurance policy" for your capital. It recognizes that in professional trading, knowing when not to trade is just as important as knowing when to enter. By providing a clean, objective measure of market stagnation, it removes the emotional urge to "force" trades during low-probability conditions.
Whether integrated into an automated Expert Advisor or used as a manual confirmation tool, the Flat Market Indicator provides the structural clarity needed for consistent performance. It transforms your MetaTrader interface into a precision environment where you only engage when the market is truly ready to move.
5 Downloads
Last Update:
Apr 20, 2026 22:50 PM
Published:
Feb 03, 2026 13:15 PM
Category: