Master Market Structure with the Zig Zag 2 Indicator
Navigating the financial markets requires a clear understanding of Price Action and structural shifts. The Zig Zag 2 Indicator is an essential technical tool designed to simplify complex charts by filtering out market "noise" and highlighting significant price swings. By connecting the most important highs and lows with distinct lines, this indicator allows traders to visualize the true rhythm of the market without being distracted by minor fluctuations.
Visualizing Highs and Lows with Precision
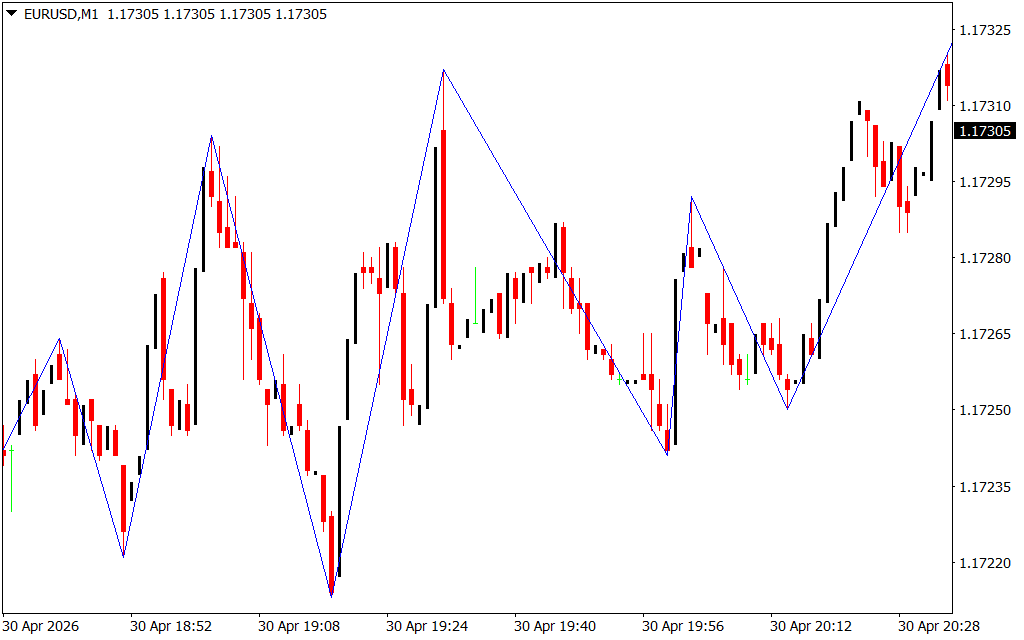
The primary function of the Zig Zag 2 Indicator is to identify swing points. In the fast-paced world of day trading, price often moves in a series of jagged waves. For many, identifying where a trend truly turns can be difficult. As demonstrated in the file EURUSDM1.png, the Zig Zag 2 plots clean, blue lines across the candlestick data, making it immediately obvious where the major peaks and troughs are located.
By focusing only on movements that exceed a specific percentage or pip threshold, the indicator helps you stay focused on the broader Market Structure. This is particularly useful for traders who utilize Elliott Wave Theory or those who look for classic chart patterns like Head and Shoulders, Double Tops, and Double Bottoms.
Why Use Zig Zag 2 for Technical Analysis?
The Zig Zag 2 Indicator is more than just a visual aid; it is a strategic foundation for several trading methodologies:
- Trend Identification: Easily spot Higher Highs and Higher Lows in an uptrend, or Lower Highs and Lower Lows in a downtrend.
- Support And Resistance Mapping: The points where the lines change direction often serve as psychological support or resistance levels in future sessions.
- Fibonacci Alignment: Many professional traders use the peaks identified by the Zig Zag 2 to anchor their Fibonacci retracement tools, ensuring their measurements are based on structural reality.
- Dynamic Filtering: Unlike the standard version, Zig Zag 2 often features enhanced algorithms to reduce "repainting" issues and provide more stable lines on lower timeframes like the M1 chart shown in EURUSDM1.png.
Enhancing Your Trading Strategy
To maximize the effectiveness of this tool, it should be paired with momentum oscillators or volume indicators. While the Zig Zag 2 is excellent at showing where the price has been, combining it with other tools can help predict where it is going. For instance, seeing a sharp Zig Zag peak align with an overbought RSI signal provides a high-probability reversal setup.
Whether you are Scalping the M1 timeframe or managing long-term swings, the Zig Zag 2 Indicator provides the clarity needed to make informed decisions. It transforms a chaotic chart into a readable map, allowing you to trade with the trend rather than against it.
2 Downloads
Last Update:
May 01, 2026 02:38 AM
Published:
Jan 29, 2026 22:38 PM
Category: