Navigating Daily Volatility with the X Xardfx Adr D1 Indicator
In the competitive world of currency trading, understanding the "breathing room" of a financial instrument is the difference between a winning entry and a premature stop-out. The X Xardfx Adr D1 is a specialized technical tool designed for the MetaTrader platform, specifically engineered to calculate and visualize the Average Daily Range (ADR). By providing real-time data on how far a pair like AUD/CHF typically moves in a single day, this indicator gives traders a mathematical edge in predicting price exhaustion.
The Importance of the Average Daily Range
The ADR is a vital metric that measures the average distance between the high and low prices of a financial instrument over a set number of days. For the daily trader, this information is critical. If an asset has already moved 90% of its ADR by midday, the probability of it continuing significantly further in that same direction is statistically low.
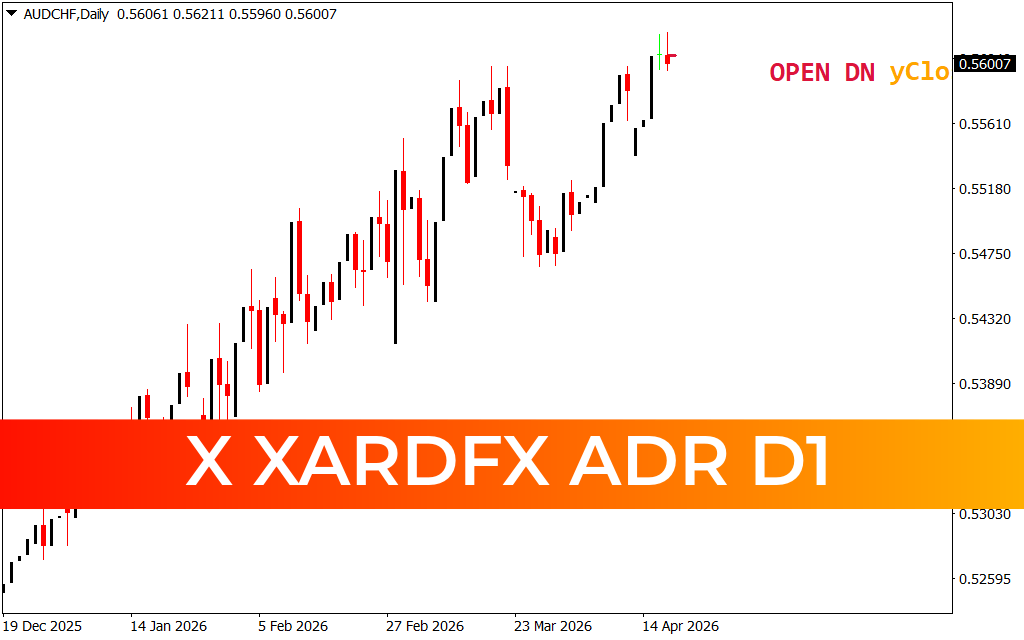
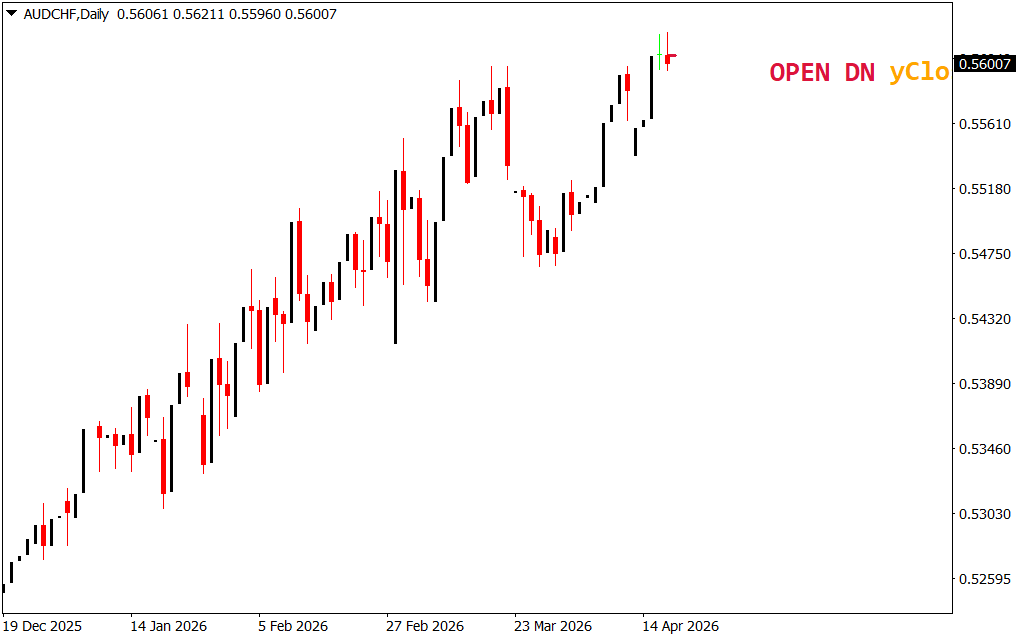
The X Xardfx Adr D1 takes this raw data and presents it through a clean, high-contrast dashboard—as seen in the AUD/CHF Daily chart. This allows you to see at a glance whether the market is "Open," "Down," or approaching its "Yesterday’s Close" (yClo) levels, providing instant context for the current trading session.
Strategic Advantages of the D1 Setup
Using the ADR on a Daily (D1) timeframe offers several strategic benefits for professional traders:
- Realistic Take-Profit Targets: Stop setting arbitrary targets. Use the X Xardfx Adr D1 to set goals based on historical volatility.
- Avoid Overextension: By knowing the daily limit, you can avoid buying at the top of a range or selling at the very bottom.
- Volatility Analysis: Spot when a pair is becoming increasingly volatile or entering a period of consolidation, allowing you to adjust your position sizing accordingly.
Designed for Professional Chart Hygiene
One of the standout features of the X Xardfx Adr D1 is its unobtrusive design. In a world of cluttered charts and "indicator soup," this tool prioritizes white-space and readability. The dashboard sits neatly in the upper corner of your screen, providing essential Price Action data (Open, DN, yClo) without obscuring the candlesticks. This makes it a perfect companion for price action traders who need hard data to back up their technical analysis.
Enhancing Your Trading System in 2026
As market dynamics shift in 2026, relying on static Support And Resistance is no longer enough. The X Xardfx Adr D1 introduces a dynamic element to your strategy. It tells you not just where the price might go, but how much energy the market has left to get there. Whether you are a swing trader holding positions for days or a day trader looking for the perfect intraday reversal point, this indicator provides the structural framework necessary for disciplined, data-driven trading.
3 Downloads
Last Update:
Apr 19, 2026 21:08 PM
Published:
Feb 03, 2026 21:59 PM
Category: