Master Market Persistence with the Variations Hurst Exponent Over Time Indicator
In the realm of quantitative finance, the ability to distinguish between a trending market and a mean-reverting one is the "holy grail" of technical analysis. Most traders rely on lagging indicators that struggle during the transition between these two states. The Variations Hurst Exponent Over Time Indicator for MT4 offers a mathematically superior alternative, providing a real-time measure of the "memory" of Price Action.
The Mathematics of Market Memory
The Hurst Exponent ($H$) is a statistical measure used to classify time series data. Unlike standard oscillators, it quantifies the long-term memory of a market. The value of the Hurst Exponent typically ranges between 0 and 1:
- $H > 0.5$ (Persistence): Indicates a trending market. If the price was up yesterday, it is likely to be up today.
- $H < 0.5$ (Anti-Persistence): Indicates a mean-reverting market. The price is likely to reverse its current direction.
- $H = 0.5$ (Random Walk): Indicates a chaotic, unpredictable market with no clear bias.
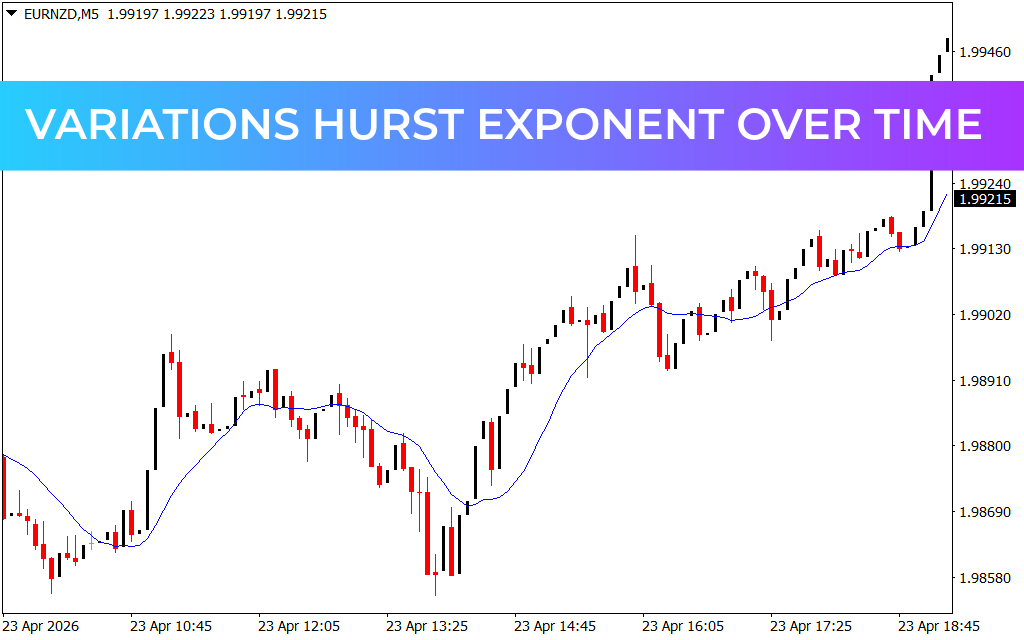
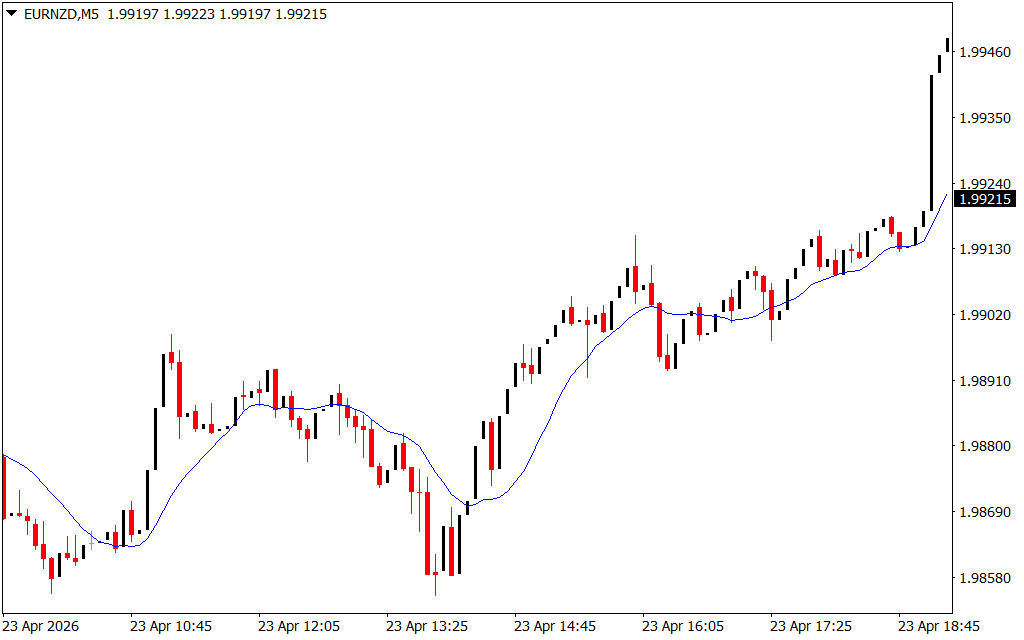
As shown in the recent EURNZD M5 price action, the Variations Hurst Exponent Over Time plots a dynamic signal line in a sub-window. By tracking how this value fluctuates over time, traders can identify when a trend is gaining strength or when the market is entering a "choppy" phase where mean-reversion strategies would be more effective.
Strategic Application on Intraday Charts
The "Variations" aspect of this indicator is crucial. Markets are not static; they shift between high persistence and high randomness throughout the trading session. On the provided EURNZD chart from April 24, 2026, the indicator maps these transitions with high-fidelity signal waves.
Around 10:45, as the EURNZD began a sustained bearish decline, a rising Hurst Exponent would have confirmed that the price move was persistent. This gives scalpers the confidence to hold their positions through minor retracements, knowing that the underlying "memory" of the market is trending. Conversely, when the Hurst value dips toward 0.5, it acts as a "stop trading" signal, warning you that the market has become random and unpredictable.
Why Quantitative Traders Choose Hurst Exponent
The Variations Hurst Exponent Over Time is a professional-grade tool that removes the emotional guesswork from trading. Its primary benefits include:
- Regime Detection: Instantly know if you should be using a trend-following system or a range-trading oscillator.
- Fractal Efficiency: Because it is based on fractal geometry, the indicator remains accurate across all timeframes, from M1 Scalping to Daily swing trading.
- Lead Signals: Shifts in the Hurst Exponent often precede significant price breakouts, allowing you to position yourself before the rest of the retail market.
Stop chasing lagging signals and start trading based on the mathematical reality of Market Structure. The Variations Hurst Exponent Over Time Indicator provides the deep-layer analysis needed to navigate the 2026 Forex market with institutional-grade precision.
1 Download
Last Update:
Apr 25, 2026 14:06 PM
Published:
Feb 02, 2026 22:00 PM
Category: