Precision Trading with the Variable Moving Average (VAMA)
In technical analysis, standard moving averages—like the Simple Moving Average (SMA) or Exponential Moving Average (EMA)—often fall short during volatile market conditions. Because they apply a fixed weight to historical price data, they are inherently prone to "lag." For traders seeking a sharper edge, the Variable Moving Average (VAMA), also known as the Variable Index Dynamic Average (VIDYA), is the superior solution.
What Makes VAMA Different?
The Variable Moving Average is a self-adjusting technical indicator. Unlike traditional averages that remain rigid regardless of market temperament, the VAMA dynamically adjusts its sensitivity based on the volatility of the asset being traded.
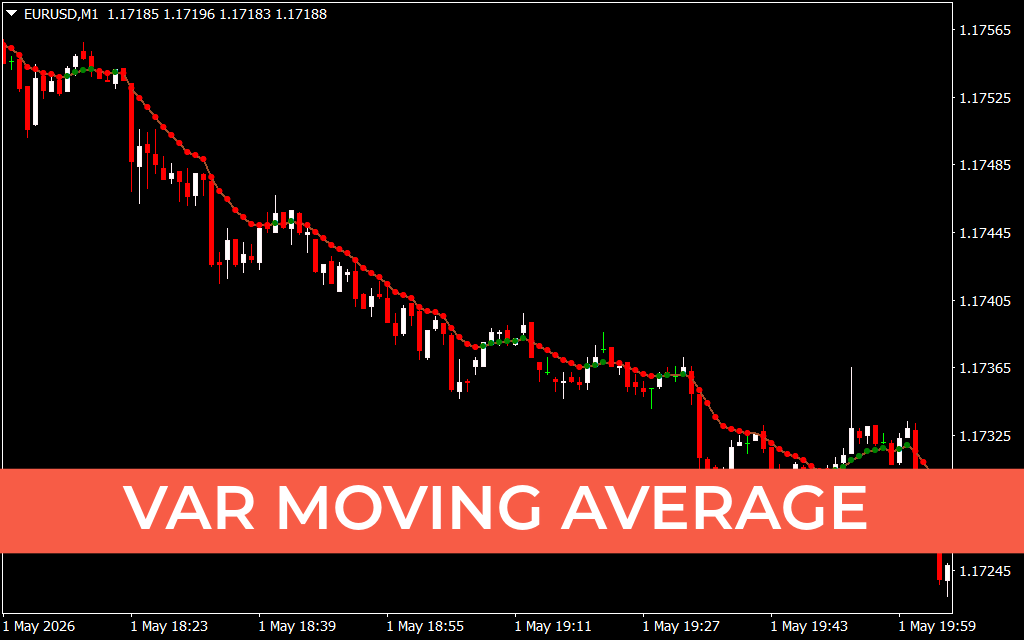
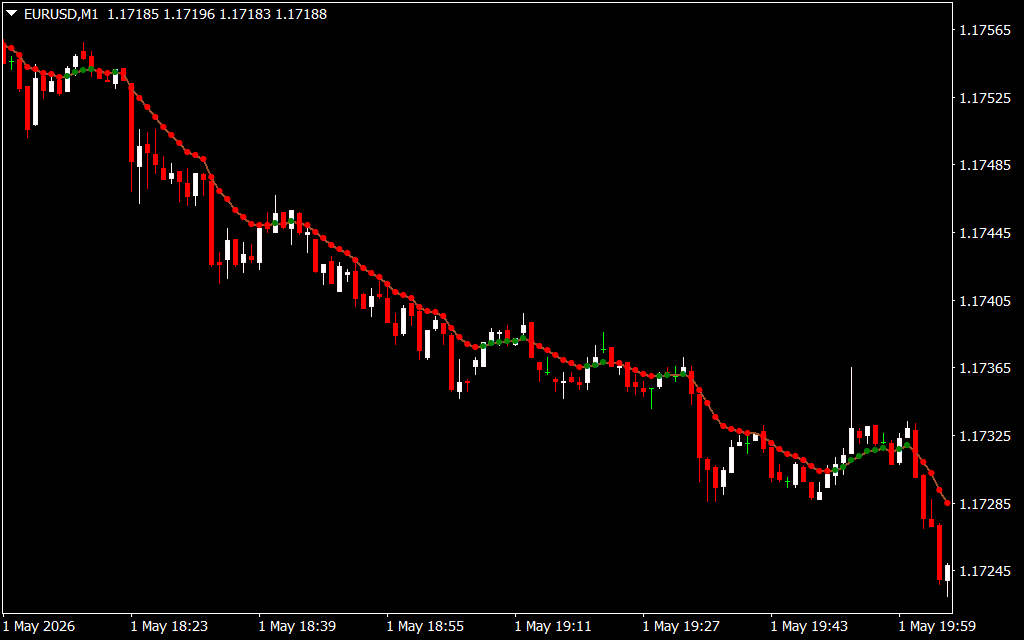
When market volatility increases, the VAMA becomes more responsive to Price Action to capture the move quickly. Conversely, when the market enters a period of consolidation or low volatility, the indicator "smooths out" its calculations to ignore noise and prevent false signals. This unique behavior makes it an indispensable tool for traders operating on high-frequency timeframes, such as the EUR/USD M1 chart.
Key Advantages for Modern Traders
- Reduced Lag: By automatically accelerating during breakouts and decelerating during ranging markets, the VAMA provides signals that are significantly closer to real-time than a standard 20-period SMA.
- Noise Filtration: One of the biggest challenges for scalpers is the "whipsaw" effect, where random price fluctuations trigger premature entries. The VAMA's internal volatility adjustment acts as a natural filter, keeping you in the trend longer.
- Intuitive Visuals: As shown in your chart, the VAMA presents as a continuous, adaptable line (often with color-coded dot markers). When the line is red, the bias is bearish; when it turns green, the bias is bullish. This instant visual feedback allows for split-second decision-making.
How to Integrate VAMA into Your Strategy
To get the most out of the Variable Moving Average, treat it as your "trend baseline."
- Trend Following: When price closes above the VAMA line, it is a confirmation of bullish momentum. Conversely, a close below indicates a bearish shift.
- Dynamic Support And Resistance: You will often notice that price pulls back to "retest" the VAMA line before continuing in the direction of the trend. Use these retests as entry opportunities rather than chasing price when it is overextended.
- Multi-Indicator Confirmation: While the VAMA is excellent at identifying the trend, pair it with an oscillator like the Stochastic or RSI to ensure you aren't buying into an overbought condition.
By using the VAMA, you are moving away from outdated, rigid indicators and adopting a dynamic approach that evolves alongside the market. It is the perfect tool for traders who prioritize responsiveness and accuracy in every tick.
5 Downloads
Last Update:
May 02, 2026 13:33 PM
Published:
Jan 29, 2026 18:06 PM
Category: