Master Daily Market Structure with the TZpivots Indicator
In the world of technical analysis, few tools are as universally respected as pivot points. They serve as the "psychological map" of the market, revealing where institutional traders are likely to enter or exit positions. However, the standard pivot calculations often fail to account for the specific timing of global market sessions. The TZpivots indicator solves this problem by providing a time-zone-adjusted framework that maps critical Support And Resistance levels with surgical precision.
The Science of TZpivots
Pivot points are predictive indicators used to identify potential support and resistance levels. Unlike moving averages, which lag behind price, pivots are "leading" indicators—they are calculated based on the previous period's high, low, and close to project levels for the current session.
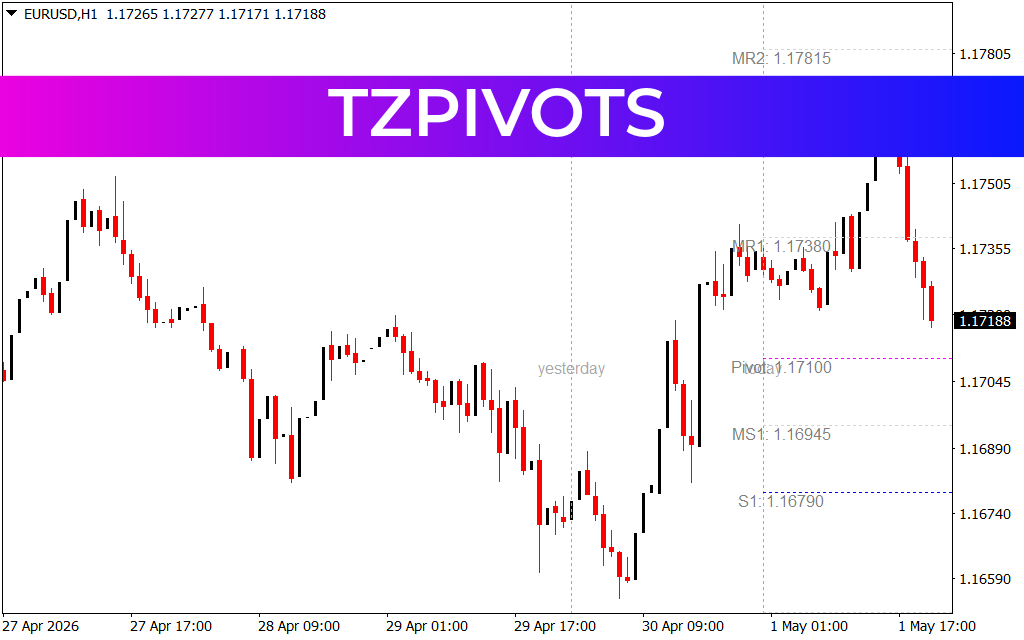
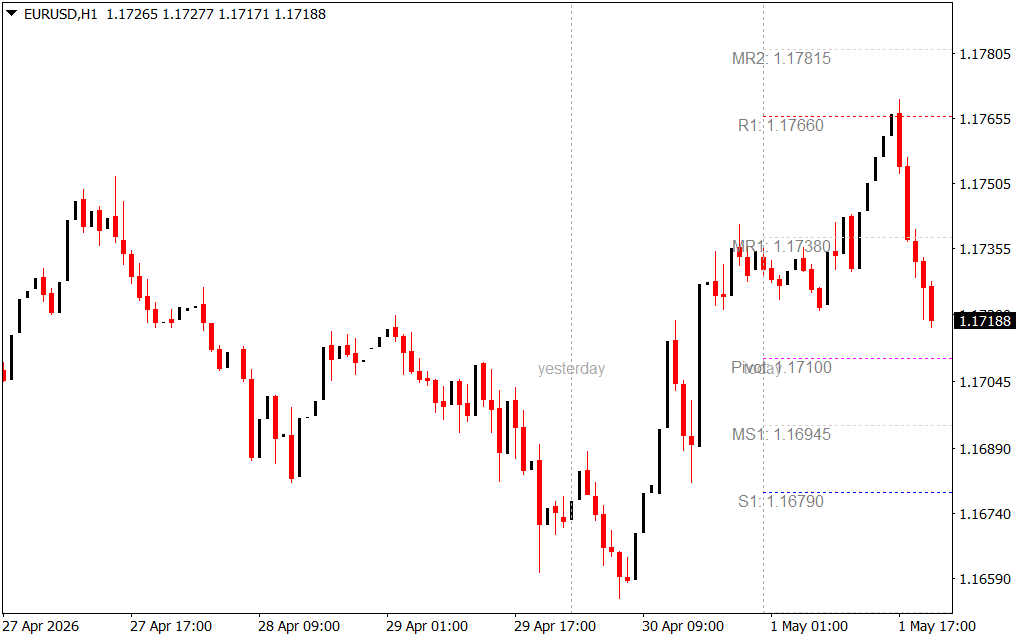
As demonstrated in the provided EUR/USD H1 chart, the TZpivots indicator plots several key levels:
- The Pivot Point (PP): The primary focal point. Price trading above the pivot indicates bullish sentiment, while price below suggests bearish control.
- Resistance Levels (R1, MR1, R2): These act as price ceilings where sellers typically wait to take profits or initiate new short positions.
- Support Levels (S1, MS1): These act as price floors where buyers often step in to defend a level.
Why Time Zones Change Everything
Standard pivot indicators usually reset at midnight server time, which may not align with the actual start of the trading day in major financial hubs like London or New York. The "TZ" in TZpivots stands for Time Zone. This indicator allows you to align your calculations with the specific session you are trading.
- Institutional Alignment: Large banks and hedge funds trade based on specific market opens. By adjusting your pivots to the London or New York open, you are looking at the same levels as the market movers.
- Increased Accuracy: When pivots align with high-volume sessions, the "bounces" off support and resistance levels become much cleaner and more predictable.
- Mid-Pivot Integration: As seen in the H1 chart example, the indicator also includes "Mid-Pivots" (like MR1 and MS1). These secondary levels are crucial for intraday scalpers who need more granular targets between major levels.
Strategic Implementation
The most effective way to use TZpivots is as a confluence tool. For example, if the price is approaching S1 and simultaneously forms a bullish pinbar or engulfing pattern, the probability of a successful long trade increases dramatically. Furthermore, because these levels are projected at the start of the session, they provide an objective framework for setting take-profit targets and stop-loss orders well before the trade is even entered.
Conclusion
The TZpivots indicator is a fundamental upgrade for any trader who relies on daily Market Structure. By providing time-zone-accurate support and resistance levels, it removes the guesswork from technical analysis and helps you trade with the conviction of a professional. Stop fighting the trend and start trading from the levels that matter with TZpivots.
3 Downloads
Last Update:
May 03, 2026 01:47 AM
Published:
Jan 28, 2026 18:18 PM
Category: