Mastering Market Symmetry: The Power of the Trend Mirror Indicator
In the world of intraday trading, identifying the balance of power between buyers and sellers is the ultimate challenge. Price Action can often feel like a chaotic series of random fluctuations, especially on lower timeframes. To find order within this movement, many professional traders turn to the Trend Mirror indicator—a specialized technical tool designed to visualize market sentiment through the lens of symmetry and divergence.
What is the Trend Mirror Indicator?
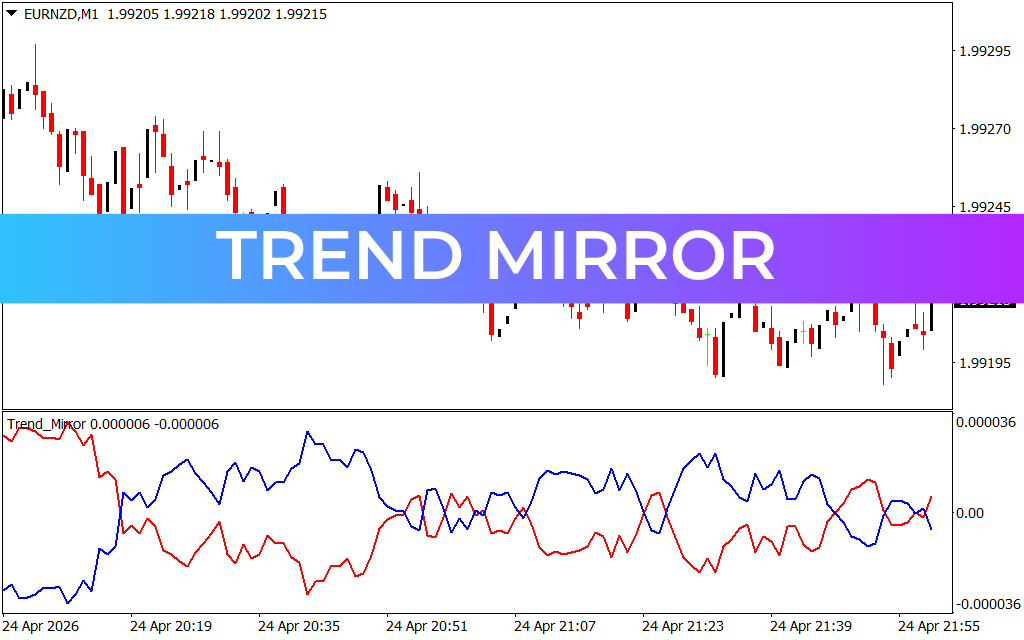
Trend Mirror is a high-sensitivity momentum oscillator that uses dual-line dynamics to represent the "push and pull" of the market. As seen in the EURNZD M1 chart, the indicator appears in a sub-window featuring two contrasting lines: a blue line and a red line.
These lines are mathematically tethered to act as reflections of one another. When the gap between them widens, it indicates a strong, trending market. When they converge or "cross over," it suggests a shift in momentum or the beginning of a consolidation phase.
Decoding the Mirror Effect
The primary value of Trend Mirror lies in its ability to show the strength of a trend relative to its recent history. Here is how traders typically interpret its signals:
- The Divergence Phase: When the blue line moves sharply upward while the red line moves sharply downward, the market is in a high-momentum state. In the provided M1 chart, you can see this occurring during the initial bearish drop, where the lines move to their extreme outer boundaries (0.000036 and -0.000036).
- The Convergence Phase: When the lines begin to move back toward the zero-line (center), it indicates that the current trend is losing steam. This is often a precursor to a reversal or a "flat" market.
- The Crossover: The moment the blue and red lines swap positions is a critical signal. A crossover often confirms a new short-term trend, making it a favorite for scalpers looking to capture quick moves on the 1-minute and 5-minute charts.
Why Scalpers Prefer Trend Mirror on M1
On the M1 (one-minute) timeframe, speed is everything. Traditional indicators like the RSI or Moving Averages often lag too significantly to be useful for rapid entries and exits. Trend Mirror is optimized for low-latency feedback.
Because it tracks price changes tick-by-tick, it allows traders to see the exact moment a bearish trend (red line dominant) flips to a bullish recovery (blue line dominant). For a pair like EURNZD, which can be highly volatile, this visual clarity helps traders avoid "catching a falling knife" and instead wait for the mirror to confirm a bottom.
Strategic Integration
While powerful on its own, Trend Mirror is best used as a confirmation tool within a larger trading system. For example, a trader might look for price to hit a significant support level on the chart while simultaneously watching for the red and green lines to converge on the Trend Mirror. This dual-verification approach minimizes false signals and increases the probability of a successful scalp.
Conclusion
The Trend Mirror indicator provides a unique, symmetrical perspective on market volatility. By stripping away the noise of individual candlesticks and focusing on the underlying momentum, it gives traders a cleaner view of the market's direction. Whether you are an experienced scalper or a novice trader looking to improve your entry timing, Trend Mirror is a clinical tool designed to bring balance to your trading strategy.
2 Downloads
Last Update:
Apr 25, 2026 16:34 PM
Published:
Feb 02, 2026 18:11 PM
Category: