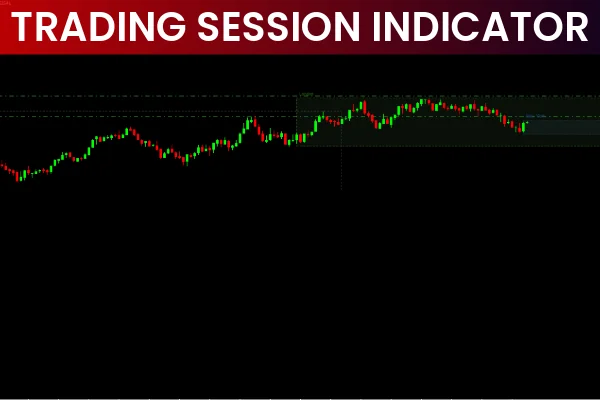
The TradingSessions Indicator is an essential analytical tool that visualizes global forex trading sessions directly on MT4 charts. Because the forex market operates 24 hours a day, traders from different regions—Asia, Europe, and North America—enter the market at different times. The overlap between these sessions creates high volatility and abundant trading opportunities. With no built-in MT4 feature that displays when traders from specific continents are active, the TradingSessions Indicator fills an important gap for technical traders.

Why Forex Trading Sessions Matter
One of the defining advantages of the forex market is its continuous, round-the-clock operation. This uninterrupted structure ensures constant liquidity and frequent price movement. With millions of participants active across time zones, traders can easily find potential entry points at any hour.
However, not all hours of the day offer the same quality of Price Action. Market conditions depend heavily on which trading session is open:
Tokyo Session – Often quieter, influenced by Asian markets
London Session – Known for high volatility and major breakouts
New York Session – Strong moves, especially when overlapping with London
Sydney Session – Typically calmer but sets early trends
Understanding these activity windows allows traders to anticipate volatility, spot reversals, and time entries more precisely.
TradingSessions Indicator Features
The TradingSessions Indicator displays colored rectangles on the chart that represent each global session. These illustrations show where price movement occurred within each timeframe and help traders connect price behavior with session activity.
Key Functionalities
Displays Tokyo, London, New York, and Sydney sessions
Shows session acronyms, timelines, and durations
Visualizes session volatility with variable rectangle height
Works on MT4, with upcoming and past sessions displayed
Provides accurate alignment with your chart’s timeframe
For example, on M30 charts, each trading session spans exactly 18 bars, offering a clear view of daily market cycles.
Session Overlaps and Market Volatility
Because each forex session lasts approximately 9 hours, overlapping periods can cause major market movement:
Tokyo–London overlap: ~1 hour
London–New York overlap: ~4 hours
Sydney–Tokyo overlap: ~7 hours
The most active and volatile periods usually occur during:
London session
New York session
London–New York overlap
These sessions frequently produce breakouts, trend continuations, and high-momentum waves—ideal for day traders and scalpers.
How Charts Are Displayed in MT4
On lower timeframes such as M30, the indicator shows detailed rectangles representing price activity. On higher timeframes (H1 and above), the indicator simplifies the display to maintain clarity. This adjustment is necessary because higher timeframes show fewer bars per session, making detailed visuals less effective.
Using the TradingSessions Indicator in Live Trading
Combining TradingSessions with Trend Indicators
While the TradingSessions Indicator does not give direct trade signals, combining it with technical tools—such as the AutoTrendLines indicator—can reveal promising trade setups.
For example:
Long candlestick shadows near an uptrend line during London or New York session indicate fading selling pressure.
Strong upward waves during active sessions confirm renewed buying interest.
Traders can place pending orders above the level from which the last corrective wave started.
A stop-loss is best placed behind both the trendline and recent shadows to protect against unexpected market spikes.
Why This Indicator Is Valuable
The TradingSessions Indicator enhances timing, improves precision, and helps traders avoid low-volatility hours. Whether you trade trends, breakouts, or reversals, session awareness is indispensable.
For more expert indicators, trading tools, and MT4/MT5 resources, visit IndicatorForest.com and explore high-quality downloads designed for professional results.
Call to Action
Boost your trading accuracy with more professional indicators and guides at IndicatorForest.com—your trusted hub for MT4 and MT5 tools.
FAQ
2 Downloads
Published:
Nov 27, 2025 09:08 AM
Category: