Master Trend Analysis with the Tipama Indicator for MT4
In the fast-paced world of Forex trading, the ability to identify a trend early and ride it to its conclusion is the ultimate skill. While the market is flooded with complex oscillators and high-lag indicators, professional traders often return to the fundamentals of Price Action and moving average relationships. The Tipama Indicator for MetaTrader 4 is a streamlined, high-performance technical tool designed to simplify trend detection and provide clear, actionable signals for day traders and scalpers alike.
What is the Tipama Indicator?
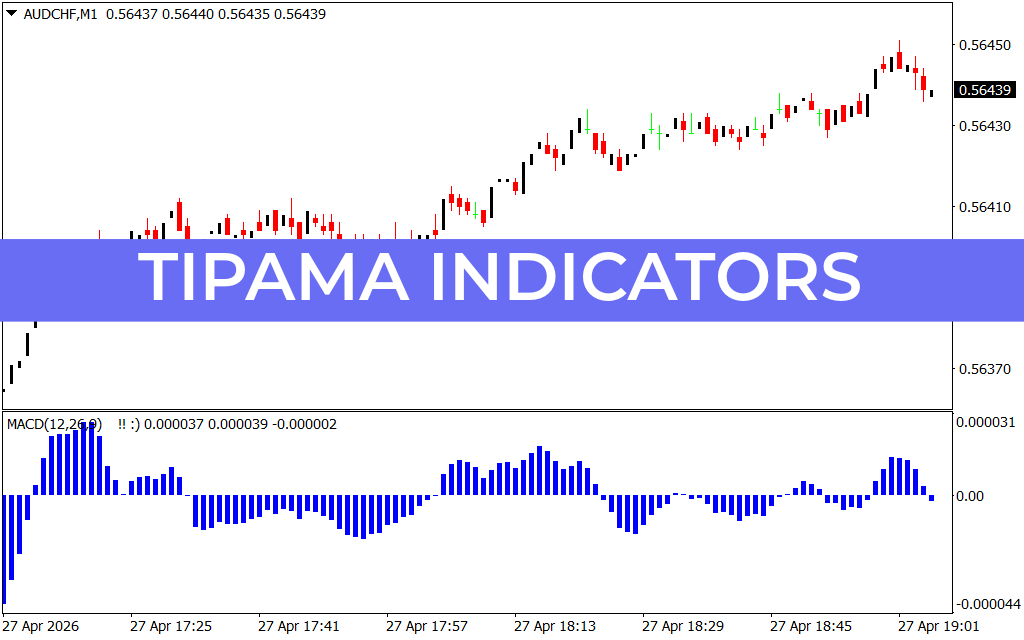
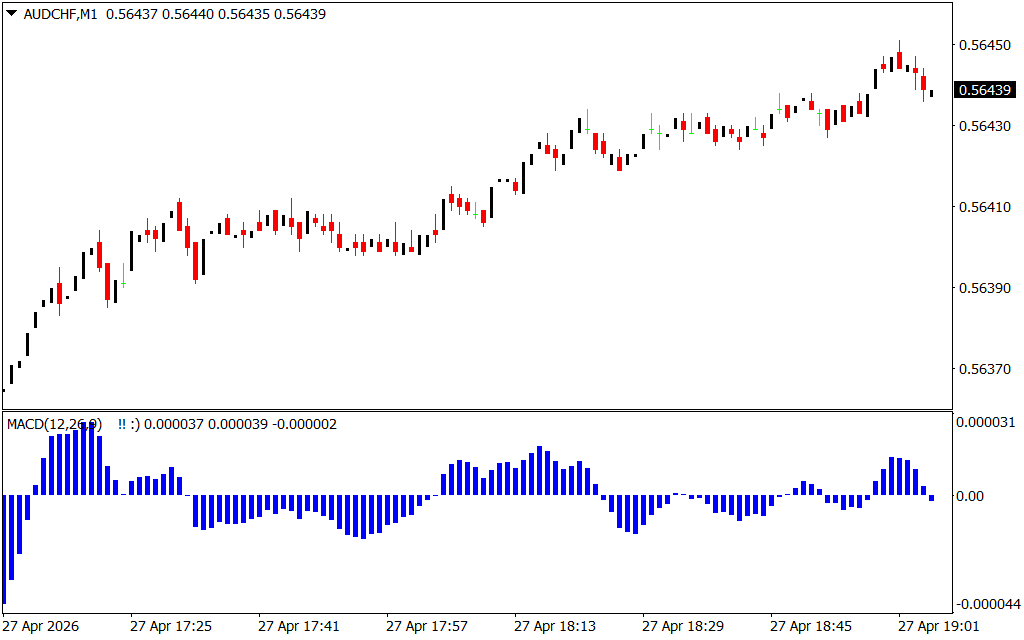
The Tipama Indicator is a specialized trend-following tool that utilizes a proprietary smoothing algorithm to filter out market noise. At its core, it acts similarly to a moving average convergence-divergence system but with a focus on responsiveness and visual clarity. As seen in the provided AUD/CHF M1 chart, the indicator appears in a dedicated sub-window as a blue histogram, often paired with a signal line to identify shifts in momentum.
The indicator tracks the "power" behind price movements:
- Rising Blue Bars: When the histogram bars are above the zero line and increasing in height, it confirms strong bullish momentum.
- Falling Bars toward Zero: This serves as a leading warning that the current trend is losing steam and a correction or reversal may be imminent.
- Bars below Zero: Indicates that the bears have taken control, signaling potential short-selling opportunities.
Why Traders Choose Tipama
The primary challenge with standard indicators is the trade-off between lag and accuracy. If an indicator is too fast, it produces "whipsaw" false signals; if it is too slow, the trader enters after the move is already over. The Tipama Indicator strikes a perfect balance by:
- Filtering Market Noise: On lower timeframes like the M1 or M5, price action can be erratic. Tipama smooths these fluctuations, allowing you to see the underlying trend structure.
- Visual Convergence: By comparing the histogram to the zero line, traders can instantly determine market sentiment without over-analyzing raw candle patterns.
- Versatility: While highly effective for Scalping AUD/CHF or other volatile pairs, it maintains its accuracy across H1 and H4 timeframes for swing trading.
Strategic Trading with Tipama
The most effective way to utilize the Tipama Indicator is the Zero-Line Crossover Strategy.
- The Long Entry: Look for the histogram to transition from below zero to above zero. This indicates that buying pressure has officially overtaken selling pressure.
- The Short Entry: Conversely, a transition from above to below zero signals a bearish breakout.
For advanced traders, Tipama is an excellent tool for spotting divergences. If the price makes a new high but the Tipama histogram shows a lower peak, it is a strong indication that the trend is exhausted. On the provided chart, notice how the histogram's expansion perfectly aligns with the sustained bullish push, giving the trader the confidence to stay in the position.
Conclusion
The Tipama Indicator is an essential asset for any MT4 user who values clarity and precision. By automating the identification of Trend Strength and momentum shifts, it allows you to trade with the discipline of a professional.
1 Download
Last Update:
Apr 27, 2026 22:07 PM
Published:
Feb 01, 2026 12:41 PM
Category: