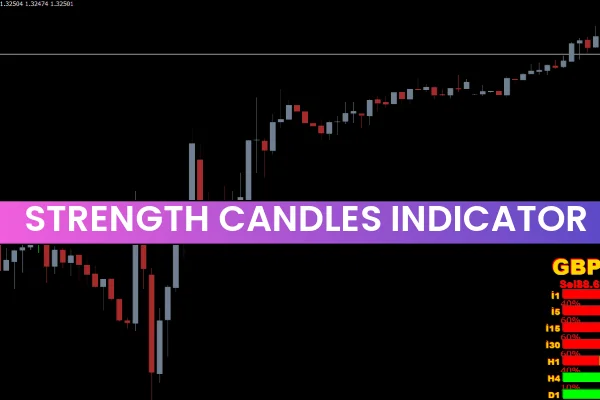
The Strength Candles Indicator for MT4 is a simple yet powerful technical tool that evaluates the bullish or bearish strength of the current candle. Traders can apply this indicator on any timeframe—from 1-minute (1M) charts up to daily (1D) charts—making it versatile for Scalping, day trading, and swing trading.
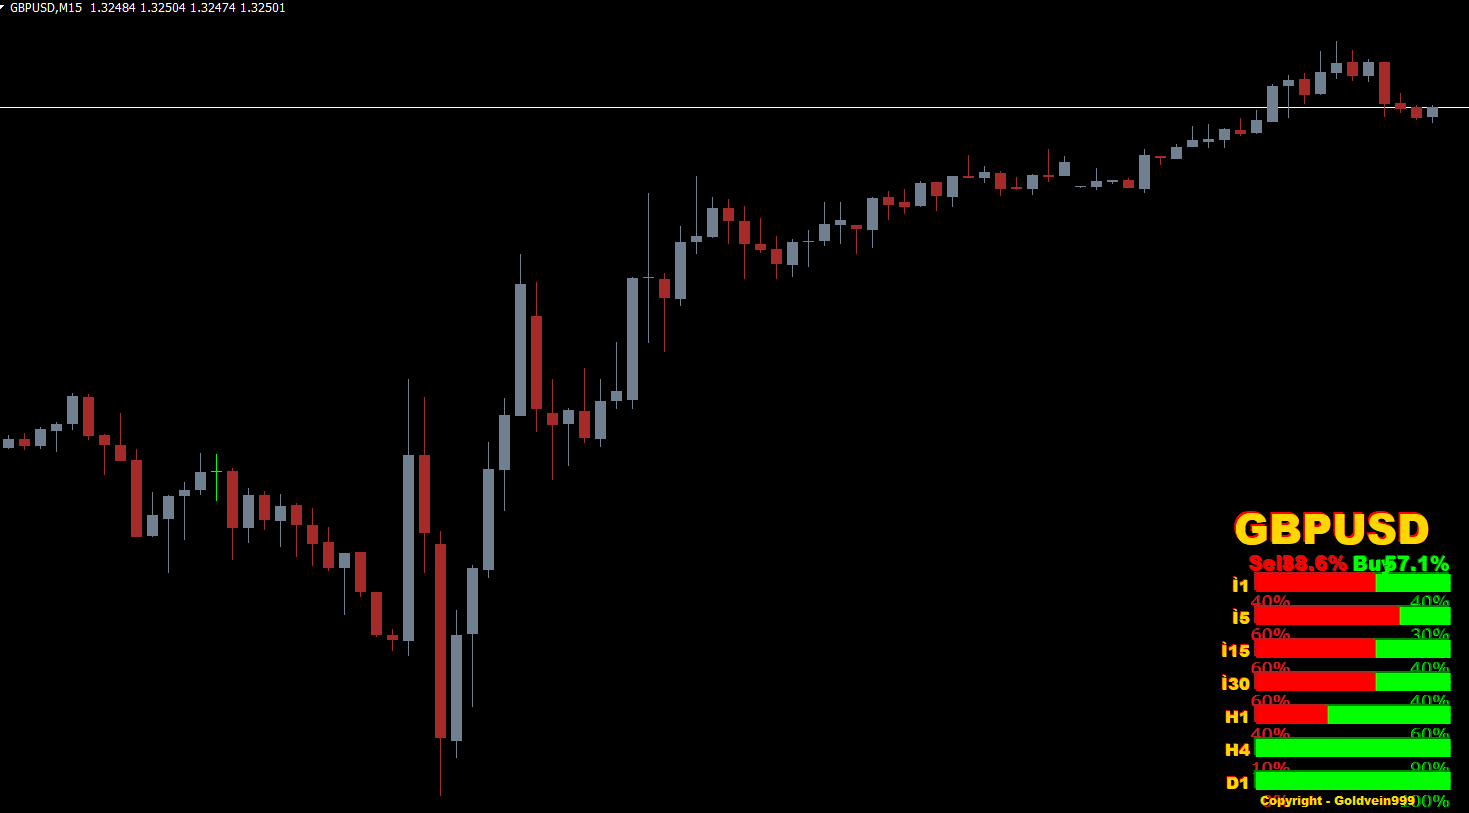
This indicator displays a percentage bar on the right side of the chart. Green percentages represent bullish strength, while red percentages represent bearish strength. With this clear visual layout, traders can easily assess the strength of the current market momentum without complex analysis.
What the Strength Candles Indicator Measures
The indicator calculates how strong or weak the current candle is relative to its open and close levels. By assigning a percentage score to candle strength, the indicator reveals:
Bullish momentum (high green percentage)
Bearish momentum (high red percentage)
Candle imbalance
The real-time power of buyers vs. sellers
Because it presents the information visually and numerically, the indicator is beginner-friendly and suitable for any trading style.
Why Traders Use the Strength Candles Indicator
The Strength Candles Indicator helps traders understand the market's immediate sentiment. Instead of relying solely on candlestick patterns, the indicator quantifies momentum in an easy-to-read format. This makes it ideal for:
Identifying early trend shifts
Confirming momentum before entering a trade
Supporting scalping strategies
Evaluating candle strength during volatile sessions
Filtering false signals in ranging markets
Whether you are a novice trader or an advanced analyst, this tool provides quick insights into the market’s current direction.
How to Use the Strength Candles Indicator for MT4
The screenshot example (USDJPY H4 chart) shows how the Strength Candles Indicator displays real-time percentages on the right side. While the indicator does not provide direct BUY or SELL signals, it guides decision-making through momentum readings.
Using Green Percentages (Bullish Strength)
A high green percentage indicates strong buying pressure. Traders may interpret this as:
Confirmation of a bullish trend
A sign that buyers are dominating the session
A signal to look for BUY setups using Price Action
When combined with indicators such as the RSI, Moving Averages, or Trendlines, traders get stronger confirmation for long entries.
Using Red Percentages (Bearish Strength)
A high red percentage suggests strong selling pressure. This often means:
The market is experiencing bearish momentum
A downward trend may be forming or continuing
A SELL setup is more favorable
Again, traders should confirm bearish trends through additional indicators or price action patterns before entering a trade.
Best Ways to Combine the Strength Candles Indicator
To improve effectiveness, combine this indicator with:
RSI (to check overbought/oversold regions)
Moving Averages (to validate the trend direction)
MACD (to confirm momentum alignment)
Support & Resistance levels
Using the indicator as a confluence signal increases entry accuracy and reduces false trades.
Who Should Use This Indicator?
The Strength Candles Indicator is especially helpful for:
Scalpers, who rely on momentum and quick entries
Day traders, who monitor intraday price strength
Swing traders, who want confirmation before entering higher-timeframe setups
New traders, who need a simple and clear momentum-reading tool
Its straightforward visual interface makes it suitable for all experience levels.
Conclusion
The Strength Candles Indicator for MT4 is a practical tool that displays candle strength as a percentage, helping traders evaluate bullish or bearish momentum quickly. It is particularly useful for scalping and trend confirmation on any timeframe.
If you want to add more precision and clarity to your trading decisions, you can download the Strength Candles Indicator for free from IndicatorForest.com.
FAQ
4 Downloads
Published:
Nov 26, 2025 22:35 PM
Category: