Revolutionizing Multi-Timeframe Analysis: The Stochastic Dashboard
In the high-stakes arena of Forex trading, momentum is everything. However, tracking momentum across multiple currency pairs and timeframes simultaneously is often an overwhelming task that leads to "analysis paralysis." The Stochastic Dashboard is a sophisticated MT4/MT5 solution designed to solve this exact problem, providing a bird's-eye view of market strength and weakness through a clean, intuitive interface.
The Power of Multi-Timeframe Convergence
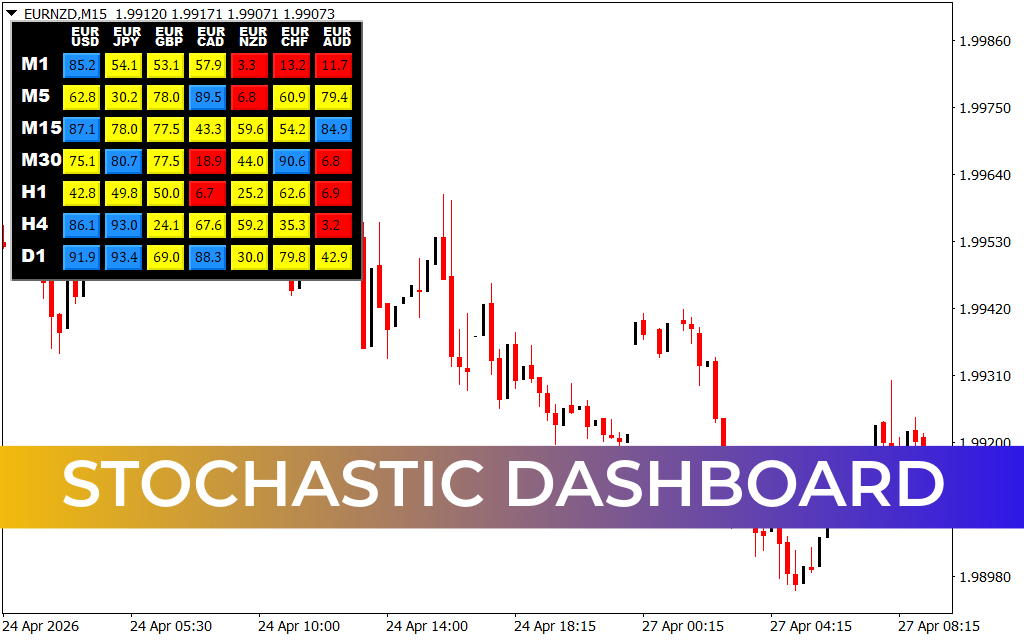
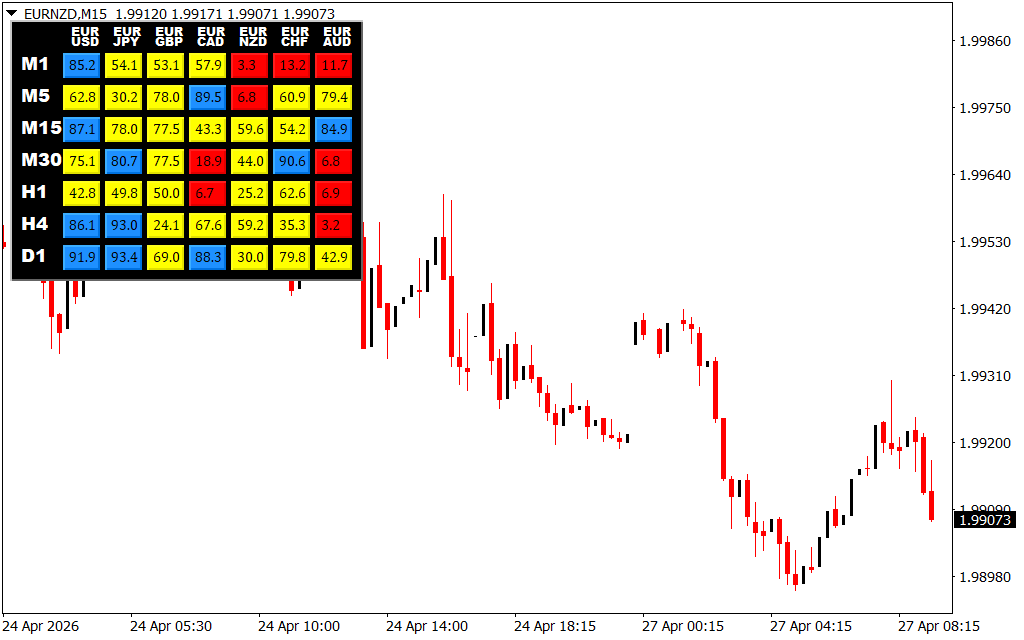
The Stochastic Oscillator has long been a staple for technical analysts, used to identify overbought and oversold conditions by measuring the speed and momentum of price movements. The Stochastic Dashboard takes this classic indicator and supercharges it. Instead of cluttering your charts with dozens of windows, this dashboard aggregates data from M1 up to Monthly timeframes into a single, color-coded matrix.
As illustrated in the EURNZD M15 chart, the dashboard displays real-time values for various EUR crosses. By scanning the grid, a trader can immediately identify confluence. For example, if a pair shows deep blue (overbought) across the H1, H4, and D1 timeframes, it signals a powerful sustained trend that may be nearing an exhaustion point, offering a high-probability reversal setup.
Streamlining Your Trading Workflow
The primary benefit of the Stochastic Dashboard is efficiency. Professional trading requires quick decision-making; manually switching through seven different timeframes for eight different pairs takes time that most scalpers and day traders simply don't have.
With this dashboard, you can:
- Filter Noise: Instantly see which pairs are ranging and which are trending.
- Identify Trend Shifts: Spot the exact moment a lower-timeframe momentum shift begins to impact the higher-timeframe trend.
- Customizable Alerts: Set specific parameters to be notified when multiple timeframes align, ensuring you never miss a "perfect storm" setup again.
Precision Meets Practicality
Whether you are a swing trader looking for daily exhaustion levels or a scalper hunting for 1-minute momentum bursts, the Stochastic Dashboard adapts to your style. The visual representation—typically using red for oversold/bearish and blue for overbought/bullish—allows for "at-a-glance" trading. This reduces cognitive load, allowing you to focus on risk management and execution rather than data entry.
In a market where seconds matter, having a centralized hub for momentum data isn't just a luxury—it's a competitive necessity. The Stochastic Dashboard transforms complex data into actionable intelligence, giving you the edge needed to navigate the global markets with confidence.
3 Downloads
Last Update:
Apr 27, 2026 12:25 PM
Published:
Feb 01, 2026 20:28 PM
Category: