Master Market Volatility with the Standard Deviation Cross Indicator
In the sophisticated trading landscape of 2026, understanding price direction is only one piece of the puzzle. To truly excel, a trader must quantify volatility—the statistical measure of price dispersion. The Standard Deviation Cross Version is a professional-grade technical indicator for MetaTrader that identifies high-probability trade setups by tracking the intersection of volatility cycles. By focusing on the "deviation" from the mean, this tool allows traders to spot explosive breakouts and trend reversals before they are visible on a standard price chart.
The Logic of Volatility Crossovers
Standard Deviation is a classic mathematical tool used to measure market intensity. When the Standard Deviation is low, the market is in a state of quiet accumulation; when it is high, the market is in a state of aggressive expansion. The Standard Deviation Cross enhances this concept by introducing a secondary signal line, creating a "crossover" system that functions as a volatility trigger.
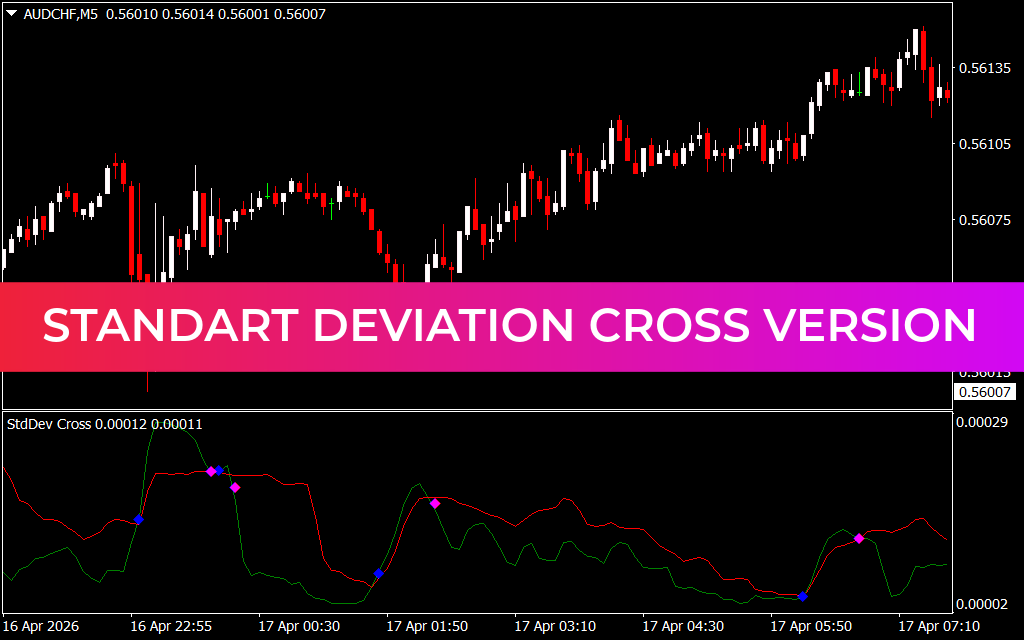
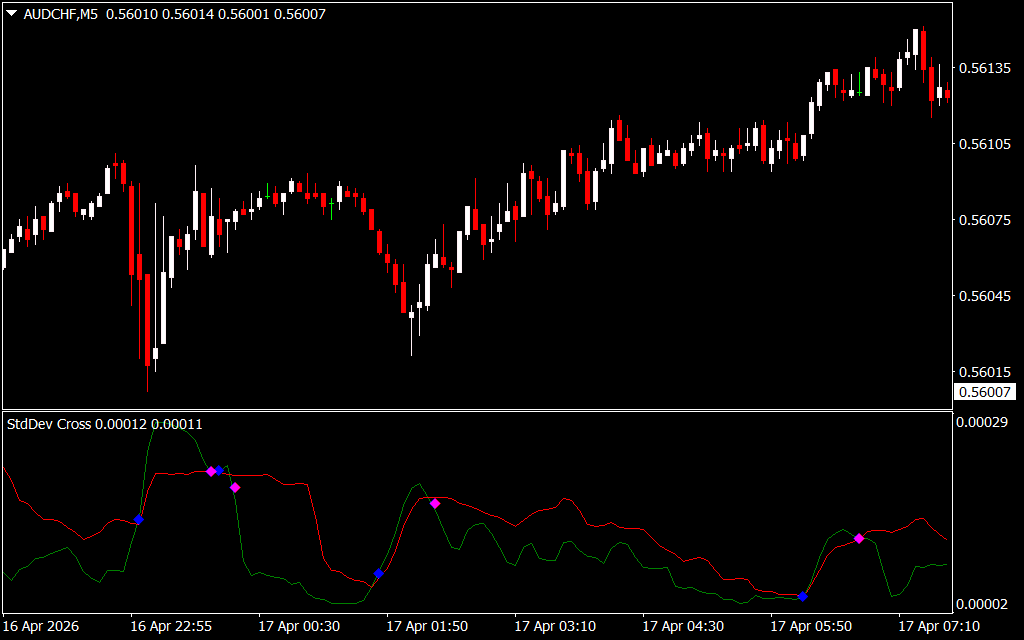
As seen in the AUD/CHF 5-minute (M5) chart, the indicator operates in a dedicated sub-window with two primary lines:
- The Green Line (Fast Volatility): Tracks the immediate statistical variance of recent Price Action.
- The Red Line (Signal/Slow Volatility): Acts as a smoothed baseline to filter out market noise.
When the green line crosses above the red line, it signals a Volatility Expansion. This is often the precursor to a major price move. Conversely, when the green line falls below the red line, the market is entering a phase of contraction or consolidation.
Identifying High-Confidence Signals
To maximize execution speed, the Standard Deviation Cross Version prints visual markers directly on the oscillator lines:
- Blue Diamonds: These represent bullish volatility crossovers, suggesting that momentum is shifting in favor of the buyers.
- Pink Diamonds: these indicate bearish volatility crossovers, signaling that selling pressure is beginning to accelerate.
For a scalper, these diamonds are invaluable. By waiting for a diamond to appear on a lower timeframe like the M5, you are essentially getting a mathematical confirmation that the "energy" of the market has shifted, significantly reducing the risk of being caught in a "fakeout" or a stagnant range.
Optimized for Professional Chart Hygiene
Success in day trading requires a clean, focused environment. The Standard Deviation Cross is designed for high-contrast dark mode charts, ensuring that the vibrant signal lines and diamonds are unmistakable against a black background. This visual clarity allows for split-second decision-making during high-volatility sessions like the London or New York opens.
A Modern Edge for Your Strategy
While standard indicators like moving averages lag behind the price, the Standard Deviation Cross Version is a leading indicator of market energy. It doesn't just tell you where the price has been; it tells you how much "fuel" is left in the current move. Whether you are a mean-reversion trader looking for price to return to the average or a breakout trader hunting for the next big surge, this indicator provides the statistical foundation necessary for a disciplined, data-driven approach in 2026.
5 Downloads
Last Update:
Apr 19, 2026 21:33 PM
Published:
Feb 03, 2026 21:29 PM
Category: