Precision Momentum: Navigating Markets with the SMI Correct Q1 Indicator
In the technical analysis toolkit, oscillators are the primary weapons for identifying overextended markets and imminent trend shifts. However, standard oscillators like the Stochastic or RSI can often suffer from "jaggedness" or provide premature signals in high-volatility environments. The SMI Correct Q1 (Stochastic Momentum Index Corrected) is a refined technical indicator designed for MetaTrader that aims to deliver a smoother, more mathematically sound representation of price momentum.
What is the SMI Correct Q1?
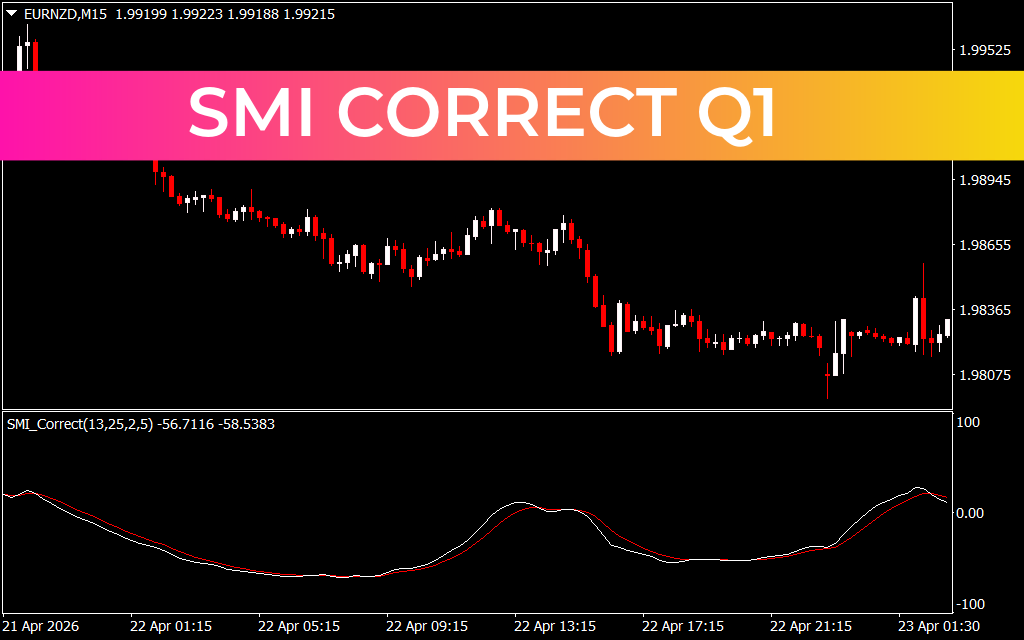
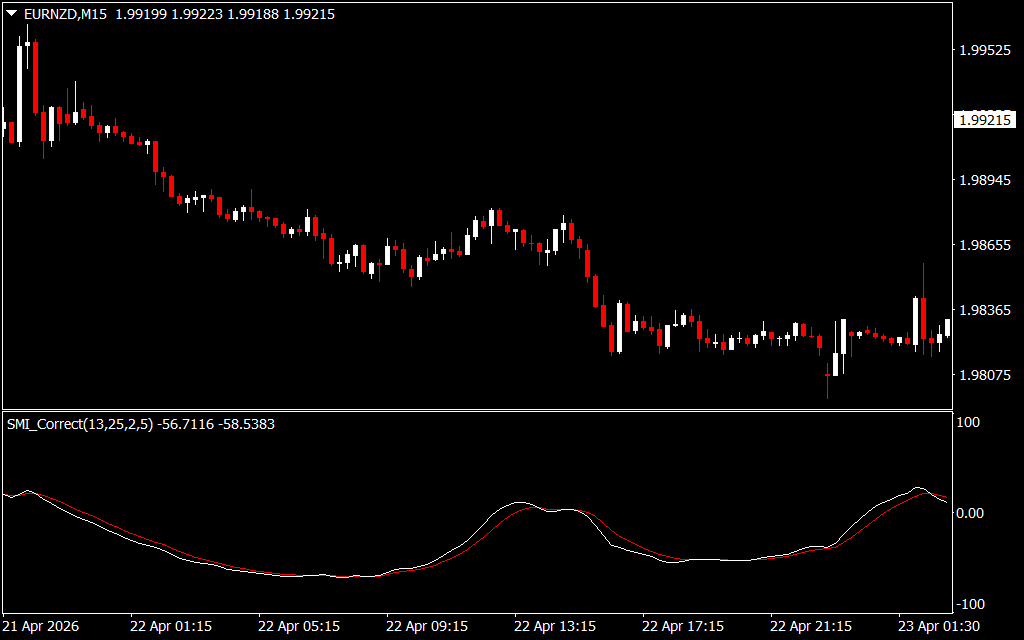
The SMI Correct Q1 is an advanced version of the traditional Stochastic Momentum Index. While a standard Stochastic measures where the current price is relative to the high-low range over a specific period, the SMI measures the distance of the current close relative to the midpoint of that range. This "corrected" version, as seen in the EURNZD M15 chart, applies an additional layer of smoothing to eliminate the erratic spikes common in lower-tier indicators.
The indicator appears in a separate sub-window with two oscillating lines: the main SMI line (white) and the signal line (red). By tracking the relationship between these two lines, traders can pinpoint the exact moment momentum shifts from bearish to bullish.
Reading the Momentum Waves
The SMI Correct Q1 operates within a range of +100 to -100, with a central zero-line acting as the ultimate trend filter. Here is how professional traders interpret the visual data:
- Zero-Line Crossovers: When the lines cross above the zero-line, the market is entering a bullish momentum phase. Conversely, a cross below zero indicates that bearish pressure is dominating the timeframe.
- Overbought and Oversold Extremes: When the oscillator dips toward the -100 level (as shown during the deep bearish move on the chart), the market is considered oversold. A "bullish cross" of the white line over the red line at these extremes is a high-probability reversal signal.
- The Smoothed Advantage: Notice the "wave-like" movement of the SMI Correct Q1. Unlike standard oscillators that flip-flop rapidly, the Q1 version maintains a steady trajectory, helping traders stay in a trend until a genuine exhaustion point is reached.
Strategic Use on the M15 Timeframe
On the 15-minute chart, timing is everything. The SMI Correct Q1 is particularly effective for "mean reversion" strategies. In the provided EURNZD example, the indicator successfully tracks the long, rounded bottom of the bearish trend. By waiting for the white line to cross back above the red line and head toward the zero-line, a trader could filter out the minor "fakeouts" that occurred during the consolidation phase.
Furthermore, it serves as an excellent tool for identifying Divergence. If the price makes a new low but the SMI Correct Q1 makes a higher low, it signals that the downward momentum is fading despite the Price Action, providing an early warning of a potential rally.
Conclusion
The SMI Correct Q1 indicator is an essential upgrade for any trader relying on momentum-based strategies. By providing a "corrected" and smoothed view of price relative to its range, it reduces the psychological stress of market noise. Whether you are Scalping intraday moves or confirming a larger trend, the SMI Correct Q1 offers the mathematical precision needed to trade with clarity.
1 Download
Last Update:
Apr 25, 2026 16:41 PM
Published:
Feb 02, 2026 17:59 PM
Category: