Master Multi-Timeframe Analysis with the Second Chart M2 Indicator
In the competitive world of financial trading, gaining a comprehensive view of market movement is essential for success. Most traders struggle with the constant need to switch between tabs or windows to compare different timeframes or assets. The Second Chart M2 indicator for MetaTrader is designed to solve this problem by allowing you to display a secondary price chart directly within your current sub-window.
What is the Second Chart M2 Indicator?
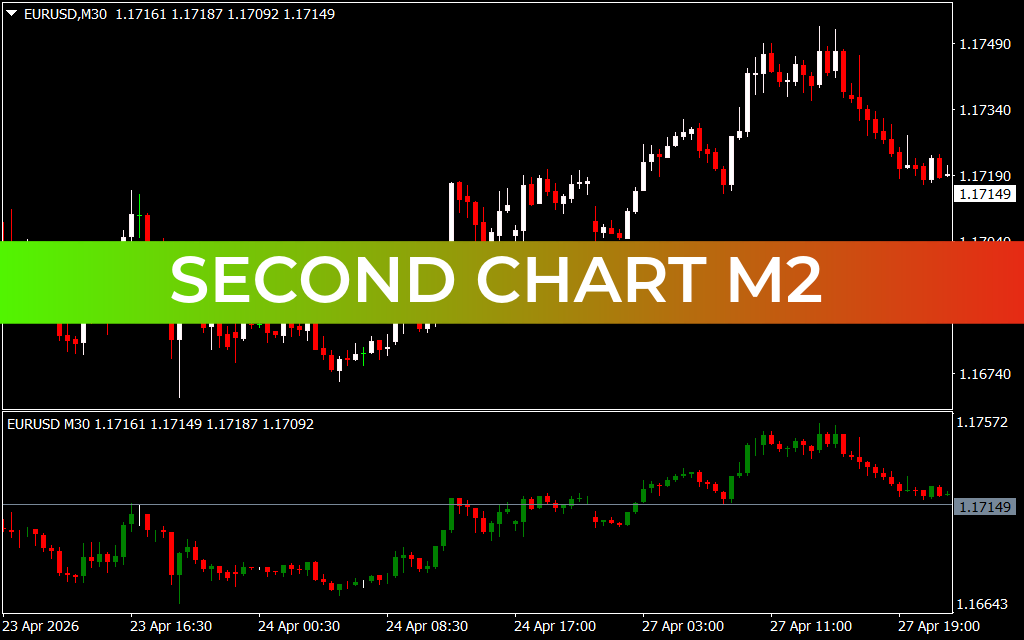
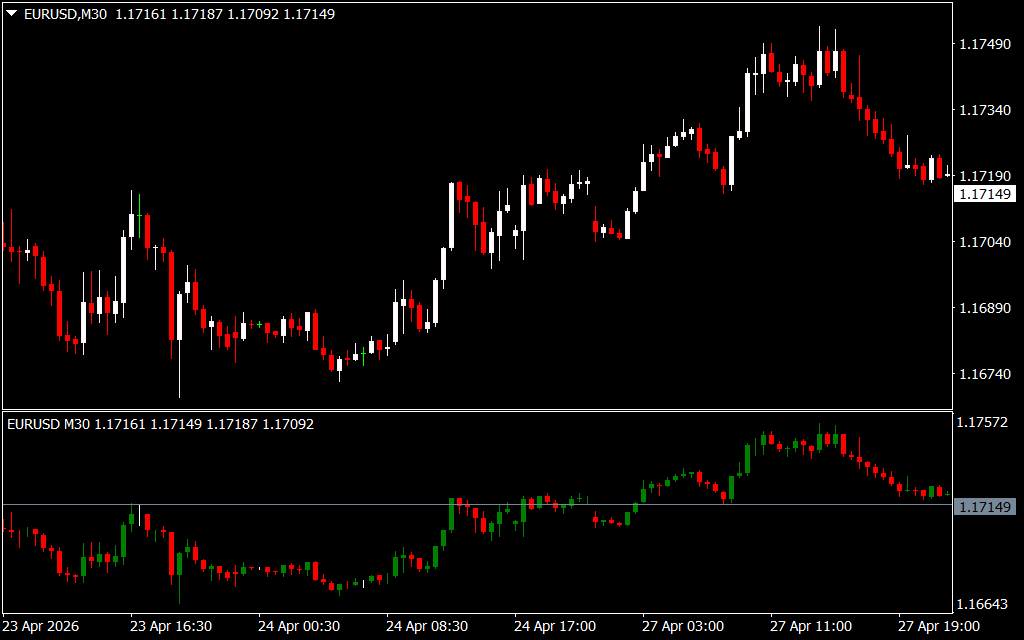
The Second Chart M2 is a powerful utility that provides a "chart within a chart" experience. It mirrors Price Action in a separate sub-window, allowing you to observe different charting styles or timeframe perspectives simultaneously. This is a game-changer for traders who rely on multi-timeframe analysis or want to compare the price action of a secondary asset without losing sight of their primary setup.
As demonstrated in the provided screenshot, the main window shows a standard EURUSD M30 candlestick chart. In the sub-window below, the Second Chart M2 replicates this movement using a distinct green and red bar format. This dual-view setup makes it significantly easier to spot divergences, confirm Trend Strength, and identify precise entry and exit points without the friction of manual navigation.
Key Features and Benefits
- Synchronized Multi-Chart View: View two versions of the market at once to compare high-timeframe trends with low-timeframe execution.
- Space-Saving Design: By utilizing the sub-window space typically reserved for oscillators, you keep your main chart clean and focused on your primary strategy.
- Enhanced Visual Recognition: The indicator uses clear color-coding (green for bullish, red for bearish) to help you instantly identify market sentiment in the secondary view.
- Customizable Parameters: Traders can adjust the display settings to fit their specific visual preferences, ensuring the second chart complements their existing technical tools.
Trading Strategies with Second Chart M2
The most effective way to utilize this indicator is through Trend Correlation.
- Identify the Anchor Trend: Use the primary chart to determine the overall market direction (e.g., a bullish trend on the M30).
- Confirm with the Second Chart: Use the sub-window to look for a smaller timeframe "pullback" or consolidation.
- Execute on Alignment: When the price action on the Second Chart M2 aligns back with the primary trend (both charts showing bullish bars), it provides a high-probability entry signal.
This method allows you to catch the "meat" of the move while minimizing the risk of entering during a temporary retracement.
Conclusion
The Second Chart M2 indicator is an indispensable tool for the modern technical analyst. It streamlines the analytical process, reduces cognitive load, and provides the visual clarity needed to make split-second trading decisions. Whether you are a professional day trader or a developing enthusiast, this indicator pro
5 Downloads
Last Update:
Apr 30, 2026 16:51 PM
Published:
Jan 30, 2026 19:02 PM
Category: