Mastering Market Momentum with Samuel Co Cluster Algorithm 2.0
In the fast-paced world of Forex trading, precision is the difference between a winning streak and a blown account. Traders are constantly bombarded with "noise"—minor price fluctuations that hide the true direction of the market. To cut through this volatility, professional traders are turning to sophisticated tools like the Samuel Co Cluster Algorithm 2.0. This advanced technical indicator is designed to simplify complex market data, providing clear, actionable insights for pairs like EURNZD and beyond.
What is the Samuel Co Cluster Algorithm 2.0?
The Samuel Co Cluster Algorithm 2.0 is a comprehensive trading solution that combines Price Action analysis with proprietary momentum clustering. Unlike standard oscillators that often lag behind the market, this algorithm utilizes a "cluster" methodology to identify areas of high liquidity and potential trend reversals.
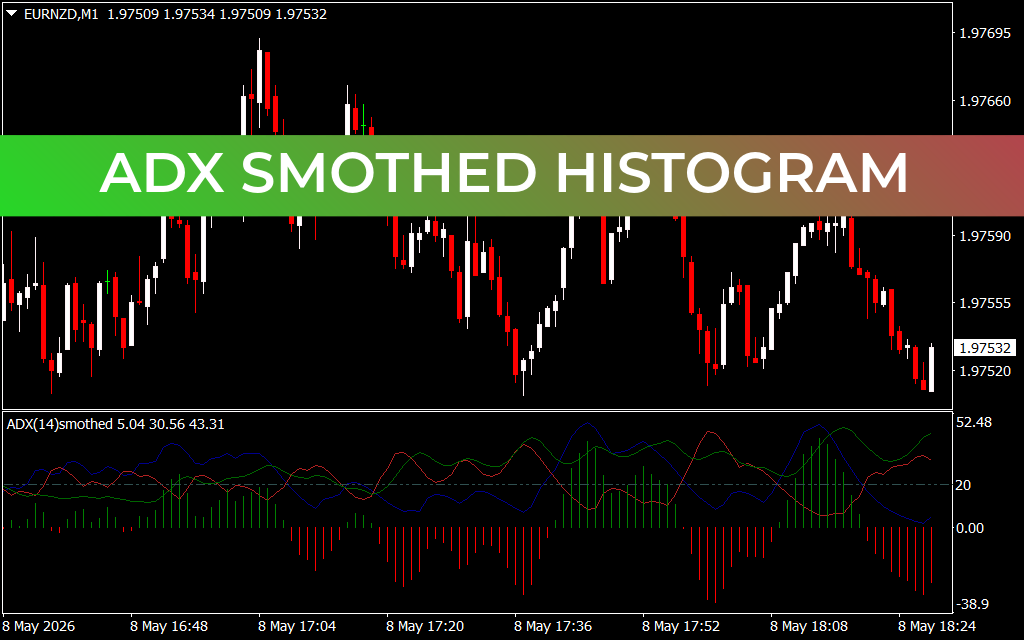
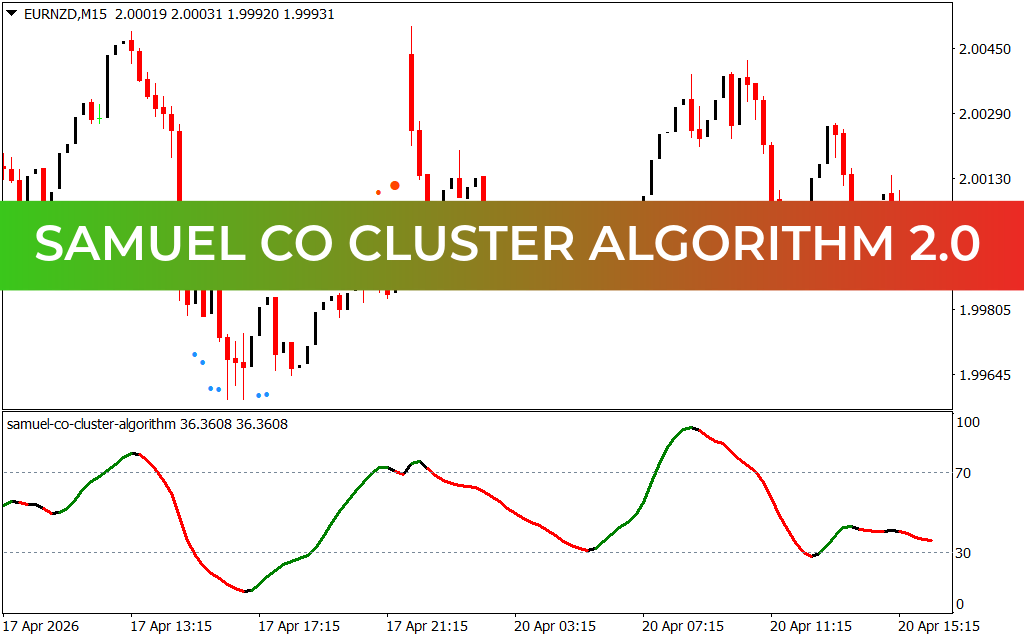
As seen on the M15 timeframe, the indicator manifests in two primary ways:
- On-Chart Signal Dots: Blue and orange dots appear near price exhaustion points, signaling potential buy or sell zones based on volume clusters.
- The Trend Oscillator: A bottom-pane window featuring a dynamic, color-coded line (Green for bullish, Red for bearish) that fluctuates between 0 and 100, highlighting overbought and oversold conditions with surgical accuracy.
Key Features for High-Probability Trading
The version 2.0 update brings several refinements to the original logic, making it more robust against market "fake-outs."
- Noise Filtration: The algorithm ignores minor retracements, ensuring you stay in a trend until a legitimate reversal is confirmed by the color-shift.
- Dual-Zone Confirmation: By using the 30/70 levels (oversold/overbought), traders can cross-reference on-chart dots with the oscillator's position to increase their win rate.
- Multi-Timeframe Versatility: While highly effective on the 15-minute (M15) chart for day trading, the logic scales effectively to higher timeframes for swing trading strategies.
Strategies for Success
To maximize the Samuel Co Cluster Algorithm 2.0, look for confluence. For instance, if the price hits a support level and the algorithm generates a blue dot while the oscillator crosses above the 30-line and turns green, you have a high-probability "Long" setup. This multi-layered approach ensures that you aren't just trading a single signal, but rather a confirmed shift in market sentiment.
In a market where seconds matter, having a visual representation of momentum allows you to trade with confidence rather than emotion. Whether you are a novice or a seasoned veteran, integrating the Cluster Algorithm 2.0 into your MetaTrader setup provides the edge needed to navigate today’s liquid markets.
4 Downloads
Last Update:
Apr 20, 2026 19:27 PM
Published:
Feb 03, 2026 17:22 PM
Category: